Manage Greengrass Devices
Manage devices describe the tools that /IOTCONNECT™ offers to manage a Greengrass device. You can view device information, get the latest values and live data, execute commands, shadow and notifications, check device health, and export historical data.
To manage a device:
- Click on the Unique ID of the respective device from the Greengrass device list. It will show you the tabs to manage a device.
Device Info
Device Info allows you to see which device is associated with which template, authentication type and entity. It also shows the display name and a device image.

(Screen: Device Info)
Component
A component is a software module that you deploy to a Greengrass core device. It performs functions like running applications, providing runtime environments (e.g., Python), managing data streams, or integrating with AWS services. Component list provides a list of how many components have been deployed into a Greengrass device.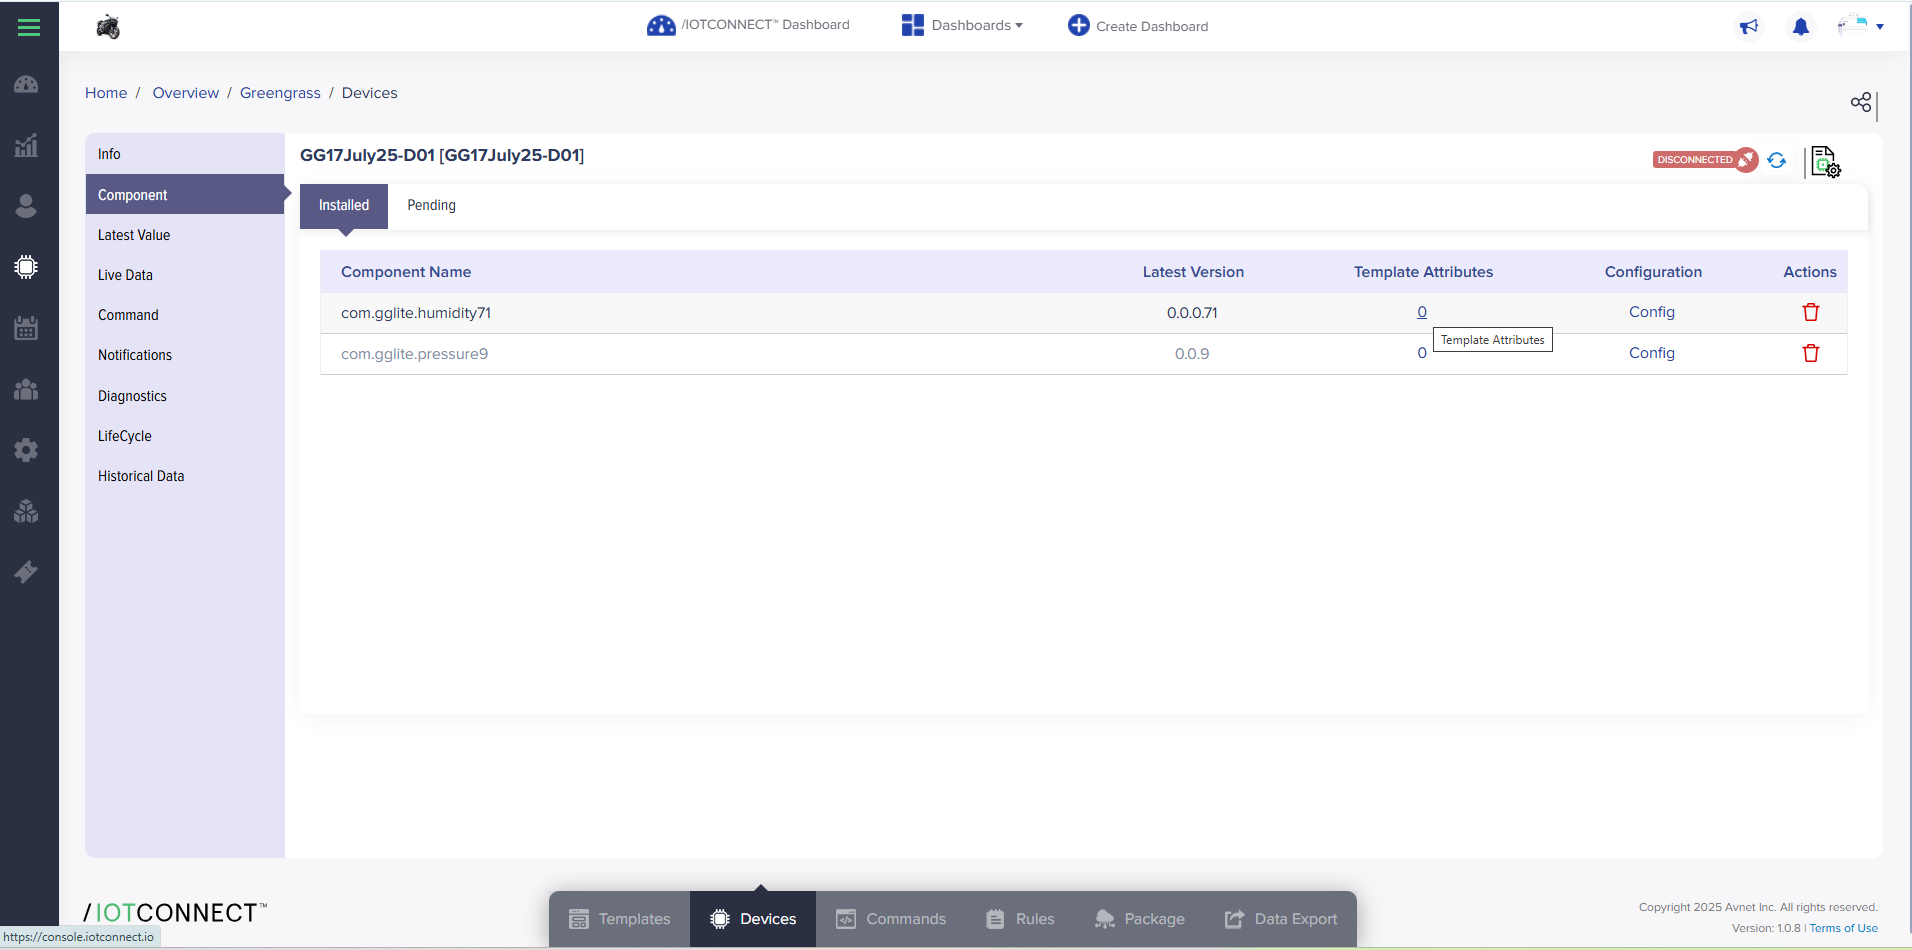
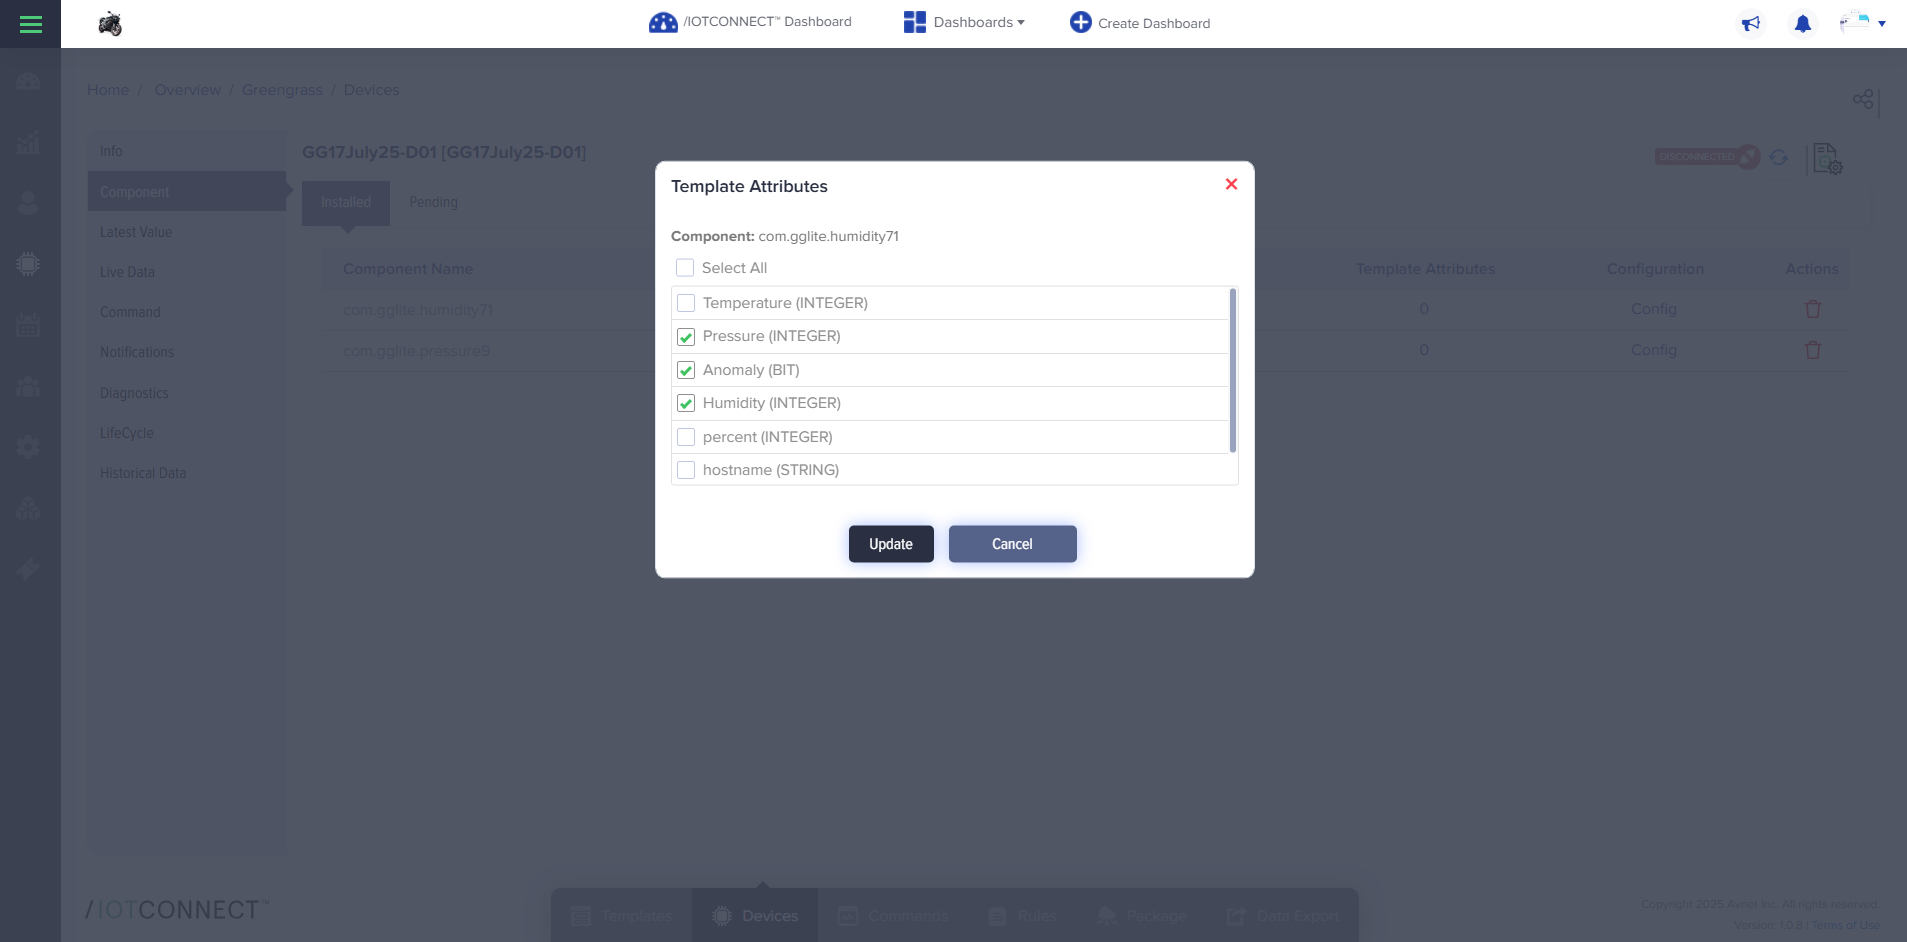
From Template Attributes, you can select the attributes you need to look into. Using this mapping live telemetry can now be segmented by components, allowing users to view real-time data for specific components.
Child Devices
A child device is a device that cannot directly connect to /IOTCONNECT™ as it does not have internet connectivity. It transfers data to the gateway device and that gateway device sends data to /IOTCONNECT™.
To add a child device, complete the required fields:
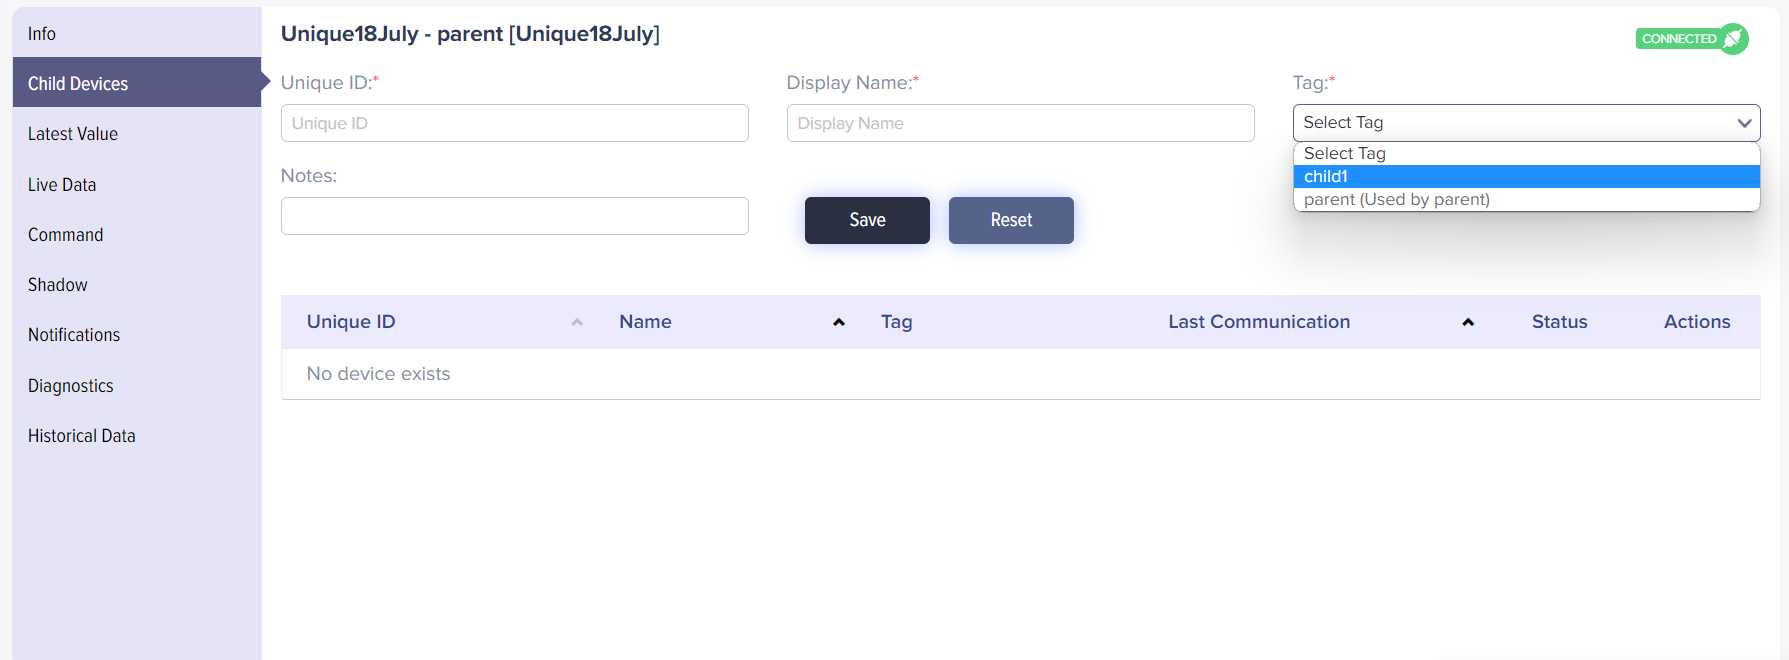
(Screen: Create Child Device)
- Unique ID – Enter a unique device identification type to help you identify the child device.
- Display Name – Enter a display name for the child device.
- Tag – Select the tag you wish to allocate to the child device. Create tags from the template. Note that the tag differentiates parent device attributes and child device attributes. Using different parent and child tags in the common gateway template, you can segregate the parent (gateway) device attributes from the child device attributes within that common gateway template.
- Notes – Enter the required notes for the child device.
Click Save to add a child device. /IOTCONNECT™ will highlight in the list below it.
Latest Value
The latest value helps you to know the last state of a device. The tab shows the date and time, attribute name, the latest data value you have received from the device and notification.
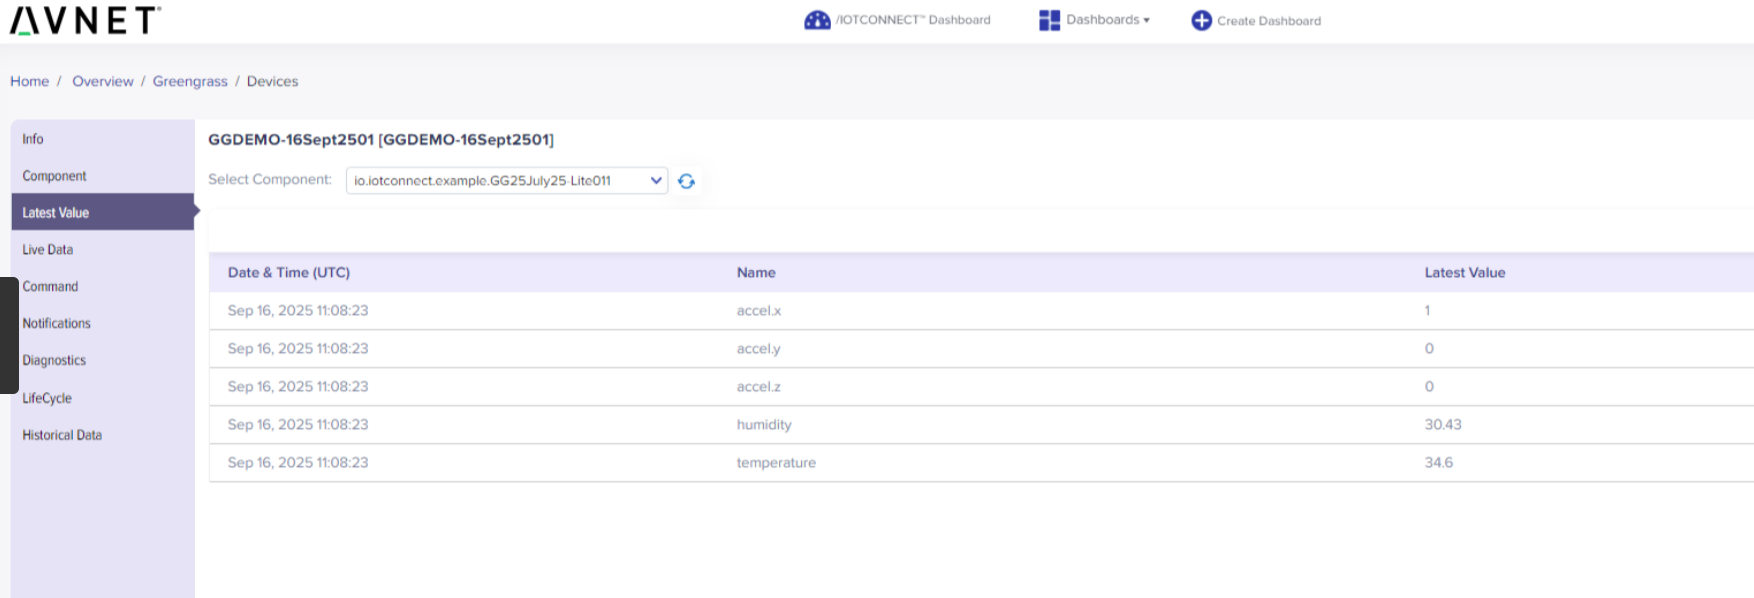
(Screen: Latest Value)
Live Data
Get the live data when the device is connected to AWS IoT Core. /IOTCONNECT™ allows you to see your live data in three ways.
Telemetry
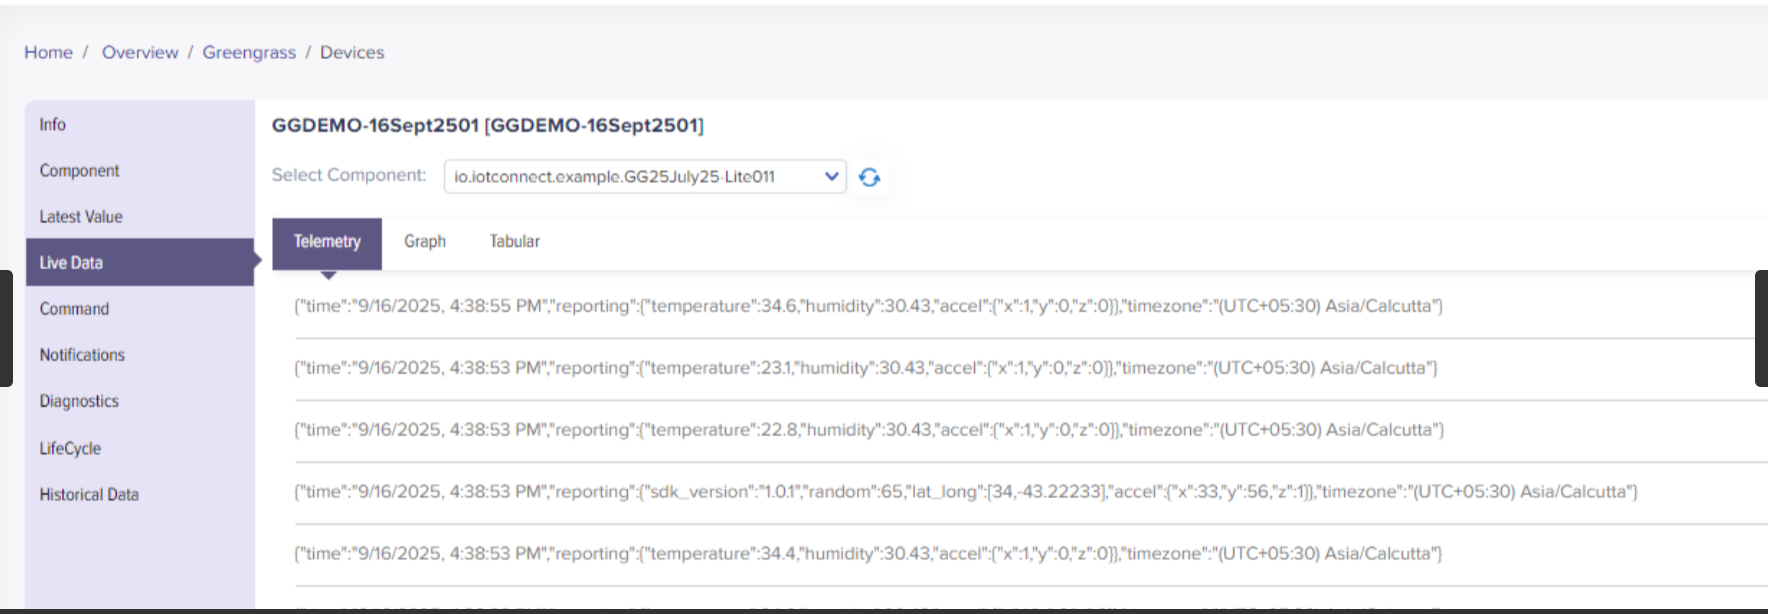
Telemetry data shows the time, reporting device measurement with precision and a time zone.
(Screen: Live Data – Telemetry)
Graph
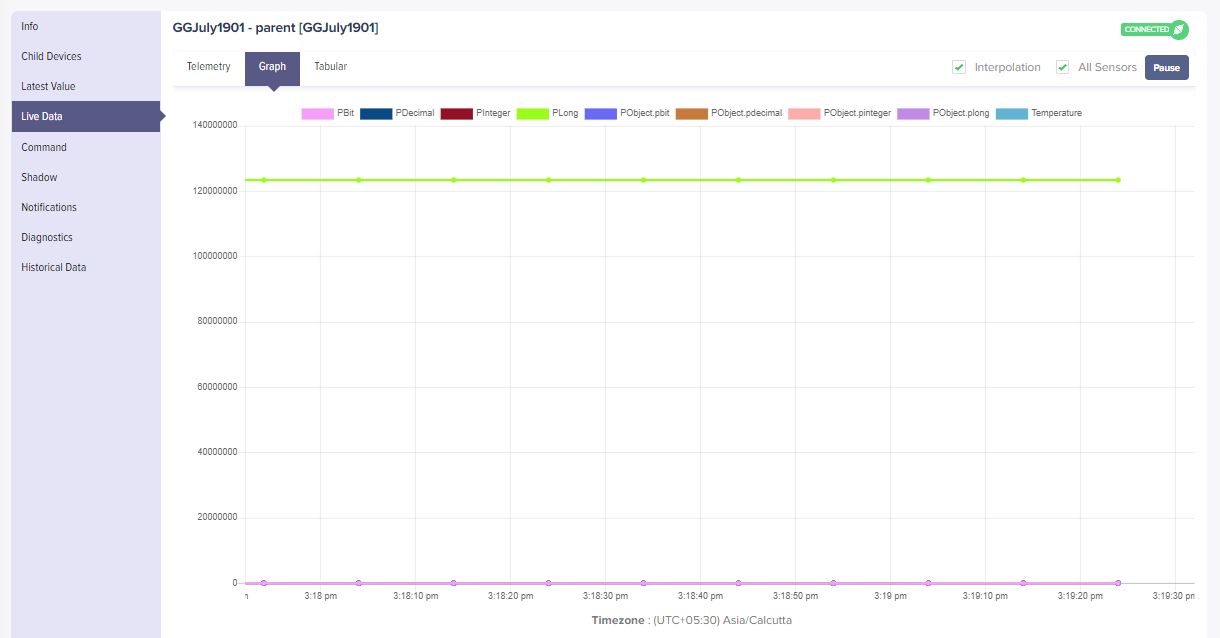
The graph presents live data in graph format.
(Screen: Live Data – Graph)
Tabular
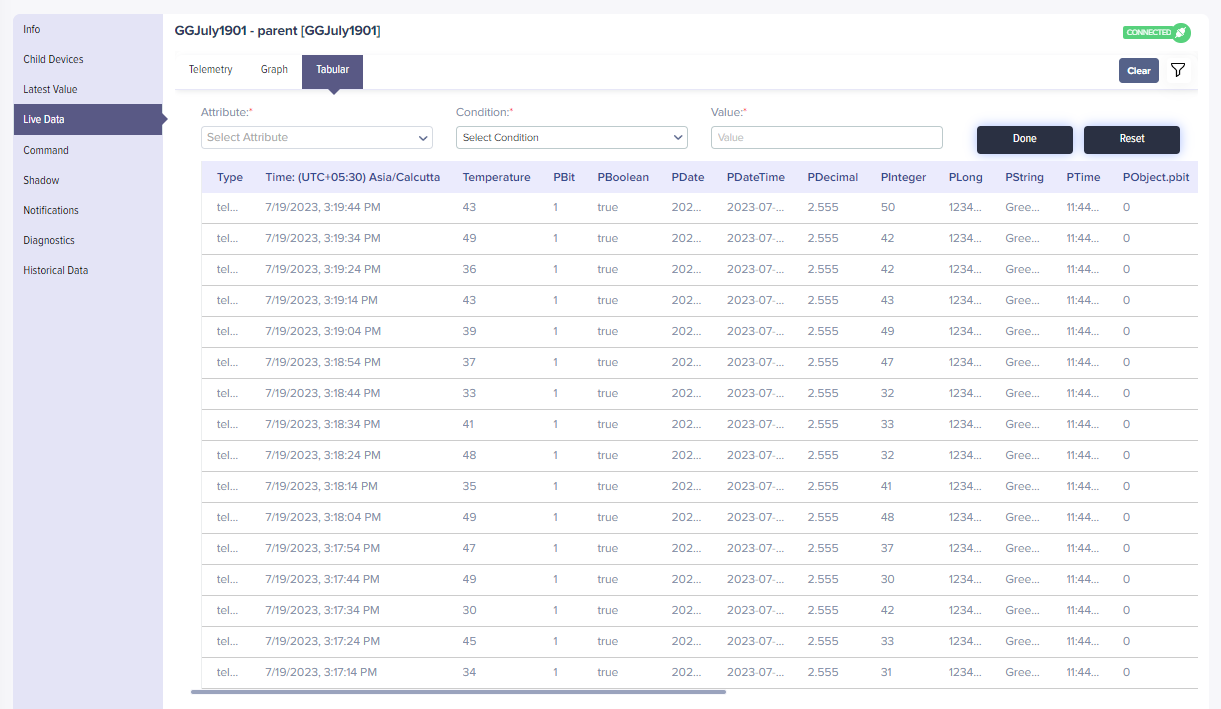
As the name suggests, it presents the data in table format. Here, you can enter the value to know the device data for attribute and condition. In the table, you will see columns for data type, time and attribute names.
(Screen: Live Data – Tabular)
Command
To execute a command:
- Select a command you have created while creating or editing a template.
- Enter the parameter value for the command.
- Click Execute Command.

(Screen: Command)
Shadow
For more information on Shadow, see details mentioned on Shadow in the template features.
To update a Shadow:
- Select a Shadow you have created while creating or editing a template.
- Enter the desired value.
- Click Update Shadow.

(Screen: Shadow)
Notifications
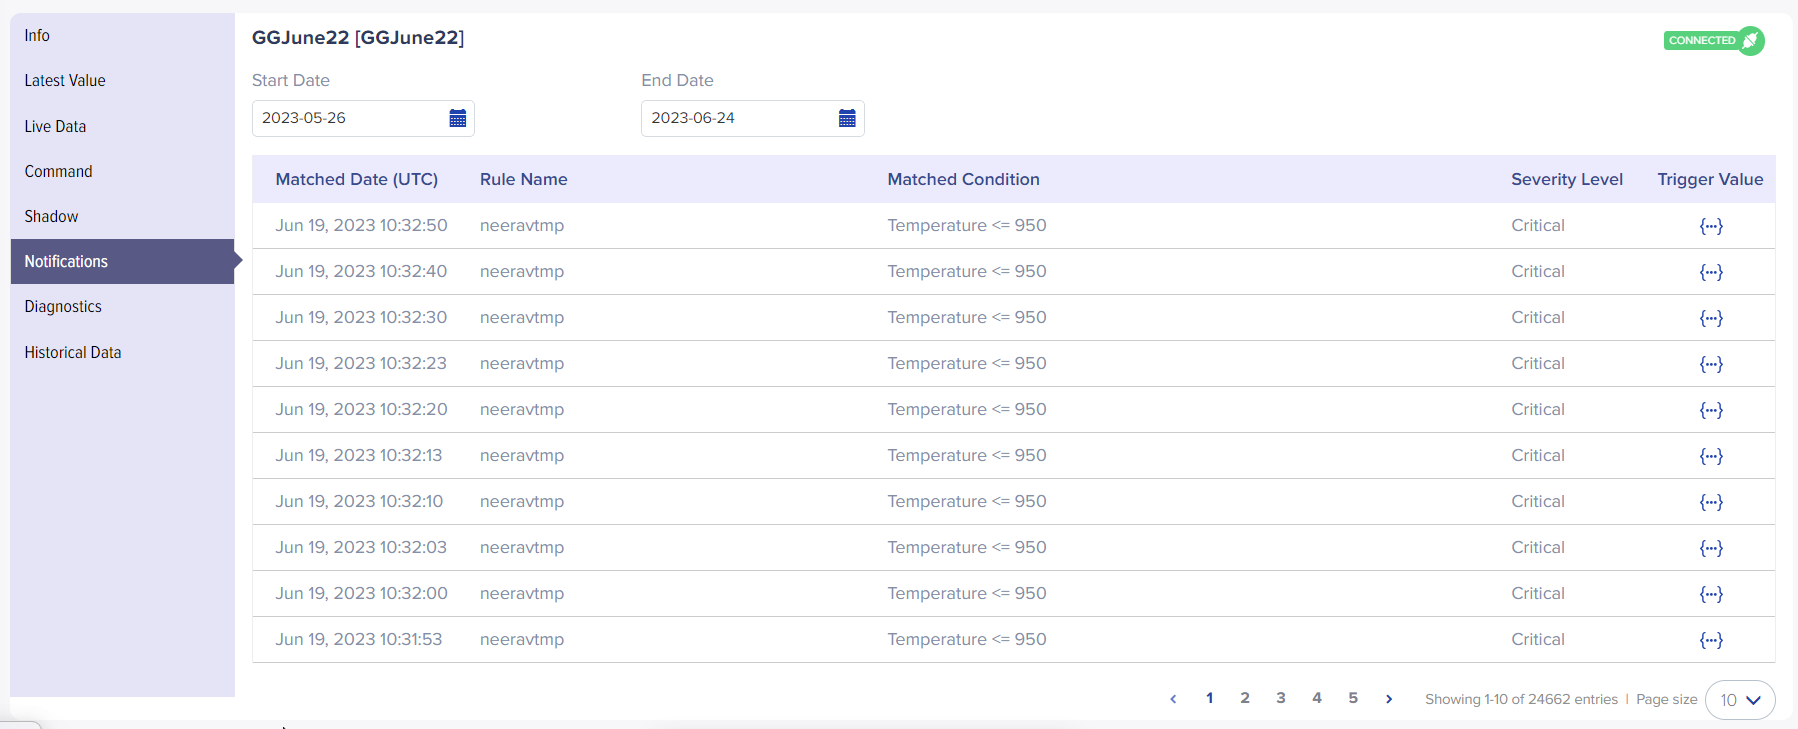
Notifications are triggered when a defined condition is met. Each notification displays the number of times it has been activated and its severity level. If necessary, you may set a preferred date range for viewing notifications.
To see notifications:
- Select the start and end date.
- The table below will update the values automatically in each column.
(Screen: Notifications)
Diagnostics
Diagnostics offers a comprehensive view of device operation over a specified duration. By selecting the required start and end dates, device operation information related to the chosen time frame is quickly accessible.
To see device operations over a specific date:
- Select the start and end date.
- The table below will update the values automatically in each column.
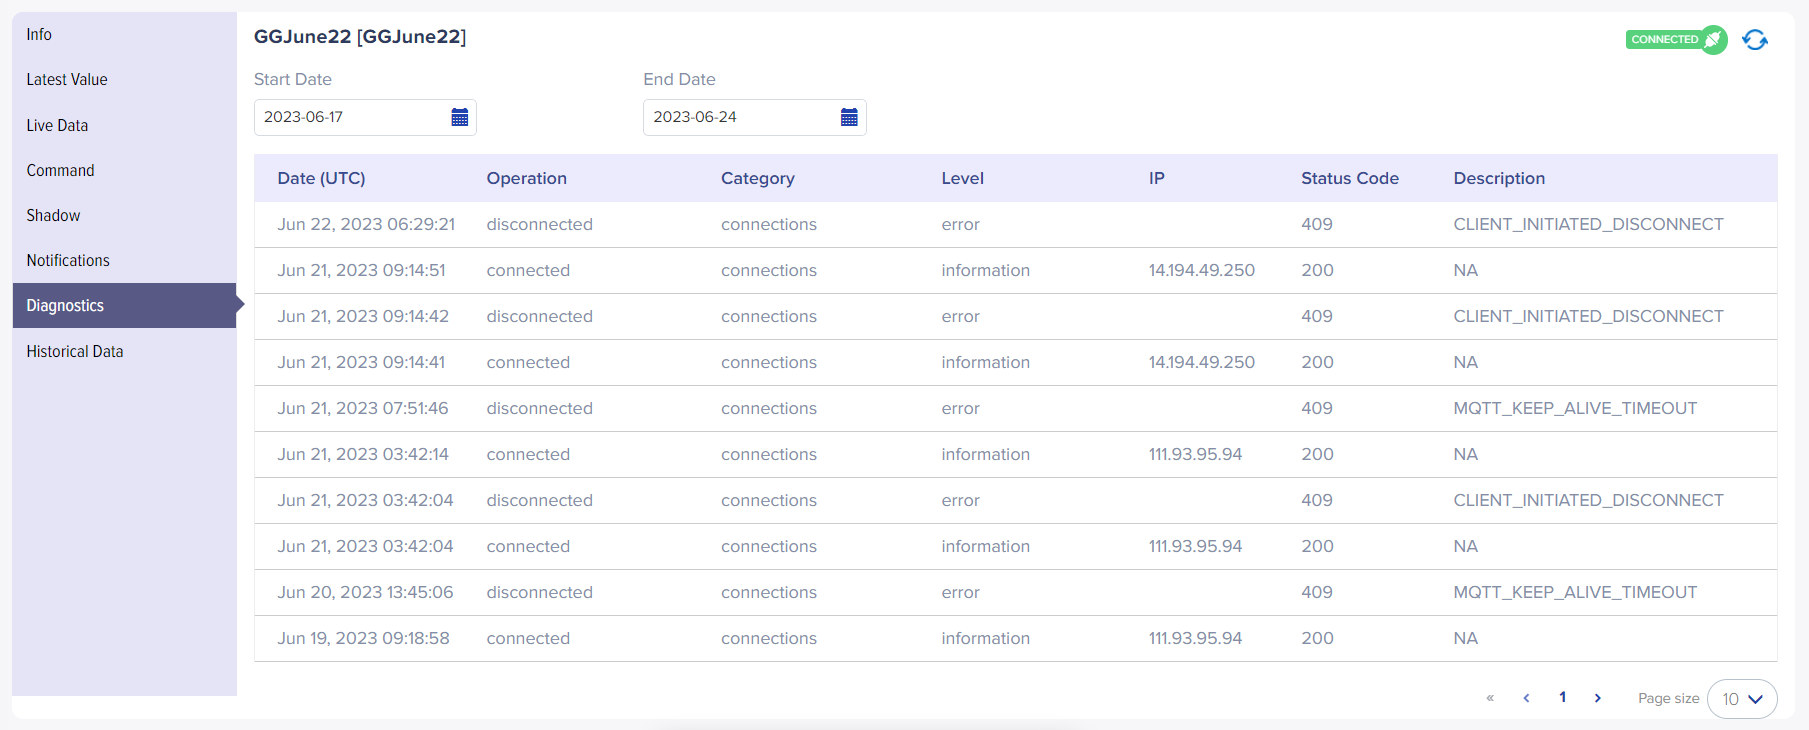
(Screen: Diagnostics)
The table highlights the date, device diagnostics operation (connected or disconnected to /IOTCONNECT™), and category. At the same time, the level provides the device information with its IP, status code and description. If there is an error, that raw shows the status code and its description, like the error is due to a connection lost, duplicate client ID, etc.
Historical Data
/IOTCONNECT™ allows you to quickly review device monitoring data by utilizing historical data. From within the application, you can run a report for each device and view it in either graph or tabular formats by setting the start and end date. Moreover, exported .csv and .xml files permit further manipulation of this information with other applications as desired. You can accomplish all these with the click of a GO button!
To see historical data:
- Select the start and end date and click GO.
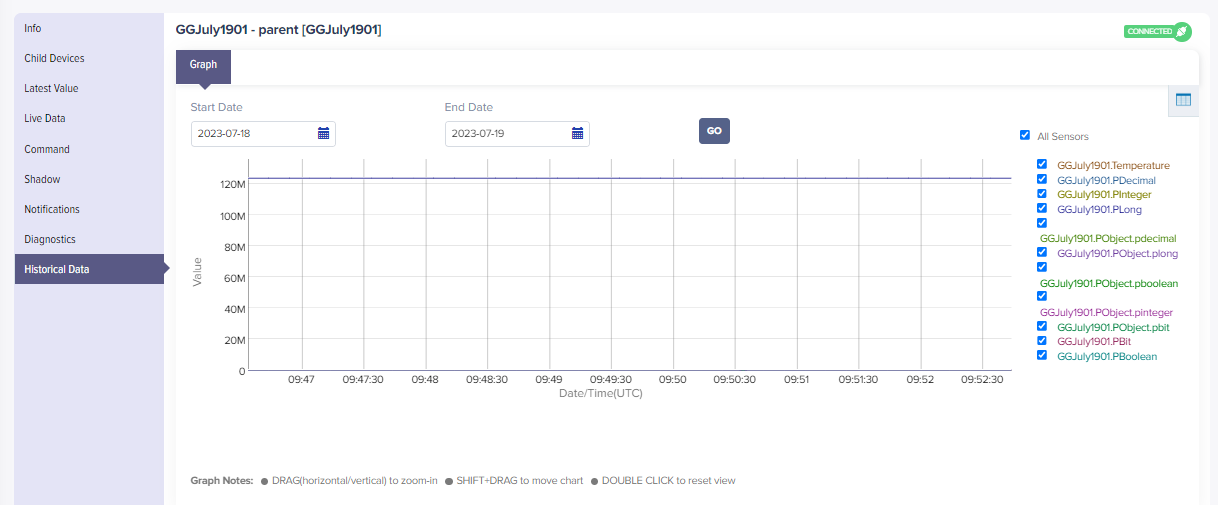
(Screen: Historical Data – Graph)
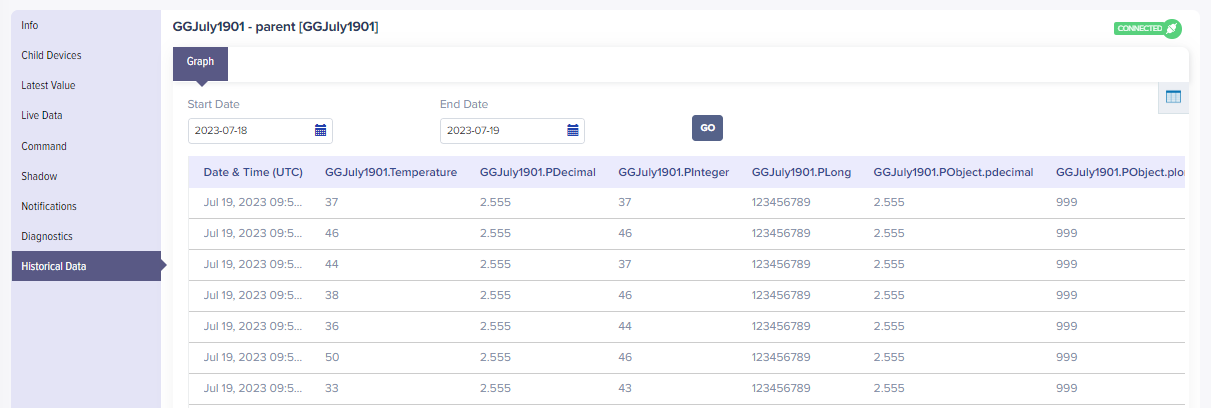
(Screen: Historical Data – Tabular)
