
Grafana Dashboard
Grafana is a powerful analytics and visualization platform that can create interactive dashboards using S3 connectors. The S3 connector plugin enables data import from an S3 bucket into a Grafana dashboard, allowing users to visualize real-time data quickly. This provides a powerful way to analyze and understand the data stored in the S3 bucket, allowing users to gain valuable insights. To use the S3 connector, you will need an S3 bucket and a Grafana account.
/IOTCONNECT™ has a widget on the dynamic dashboard which can hold the Grafana dashboard using a shared link. You need an /IOTCONNECT™ account and AWS Account with permission from S3 Bucket.
/IOTCONNECT™ provides an S3 bucket connector, which dumps all device data based on message types. We can use Athena’s external table to pull these data into Athena’s Data Set, which can be used as a data source for the Grafana dashboard.
To achieve this, you need to follow a few steps mentioned below.
Setup Connector in /IOTCONNECT™
- From the left navigation, mouseover the Settings Select the Configurations tab.
- Configurations will present various data extraction methods.
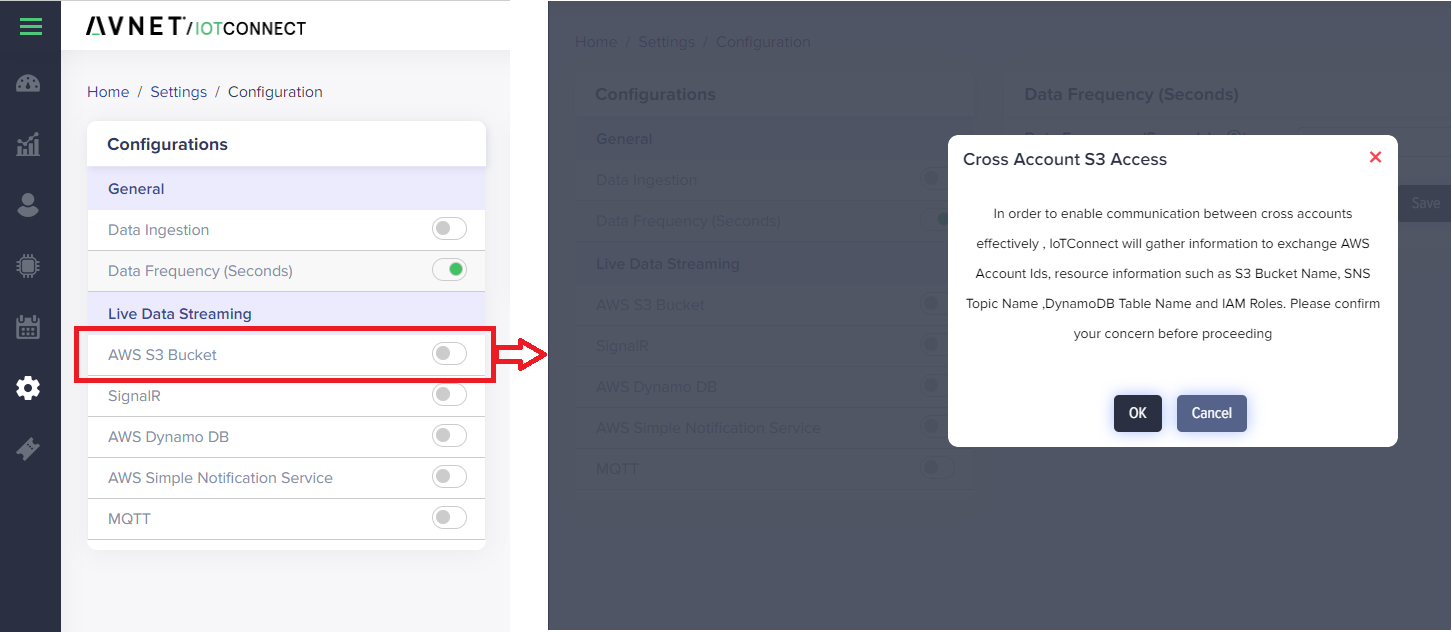
(Screen: AWS S3 Bucket Access)
- Click Ok to make the radio button ON. With that, an AWS S3 Bucket screen will appear.
You need to associate your AWS account by clicking here the link, which will open the AWS console. On successful log in, it will land at CloudFormation script, which will create the required resources into your AWS account.
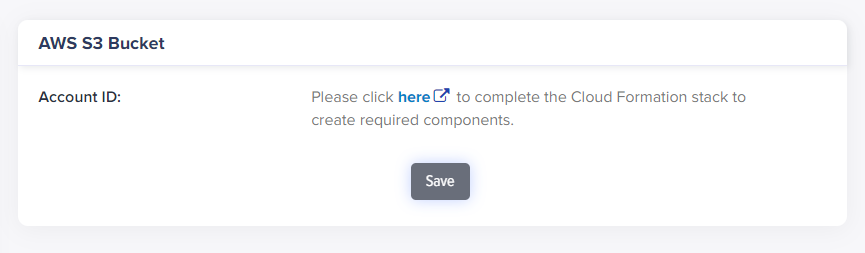
(Screen: Complete The CloudFormation Stack)
Once you log in, you will have a screen showing the CloudFormation stack screen where you have to give access at the bottom.
Note: You do not need to change any parameters on that screen. You have to acknowledge access capabilities only.
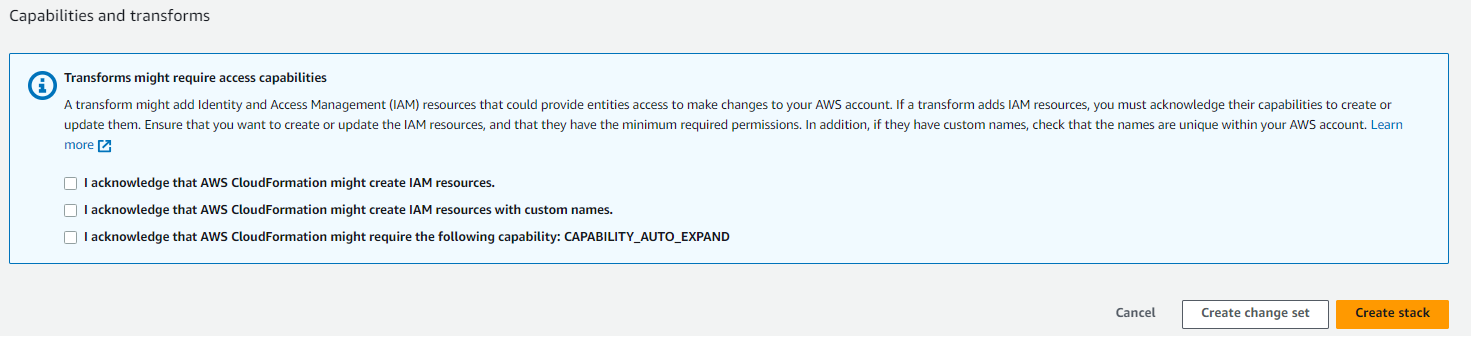
(Screen: Create CloudFormation Stack)
You will see the stack start and wait until it gets finished.
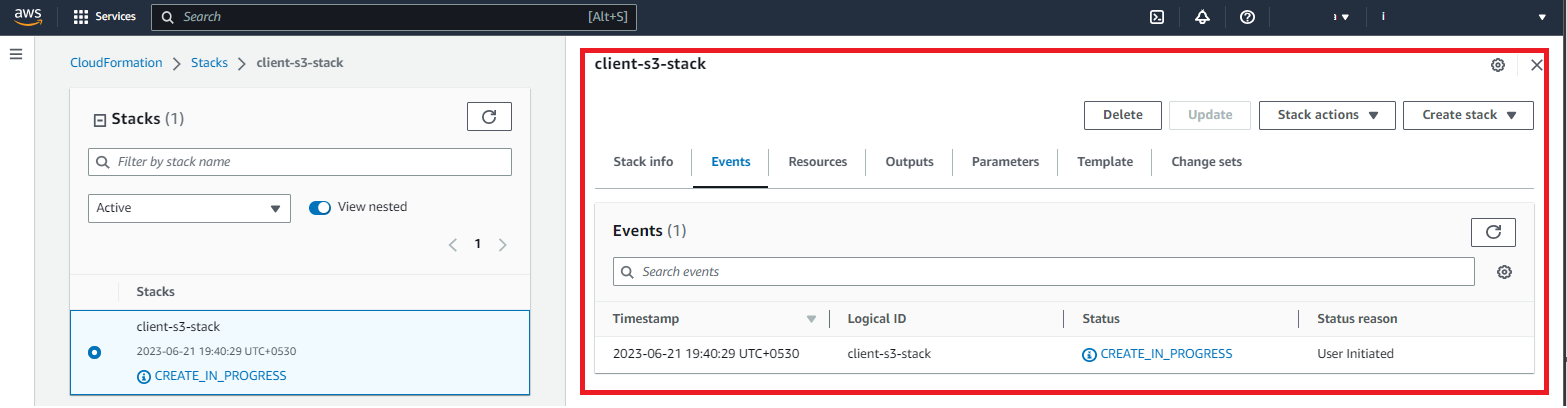
(Screen: CloudFormation Stack Creation – In Progress)
It looks like the below once the deployment stack is completed.
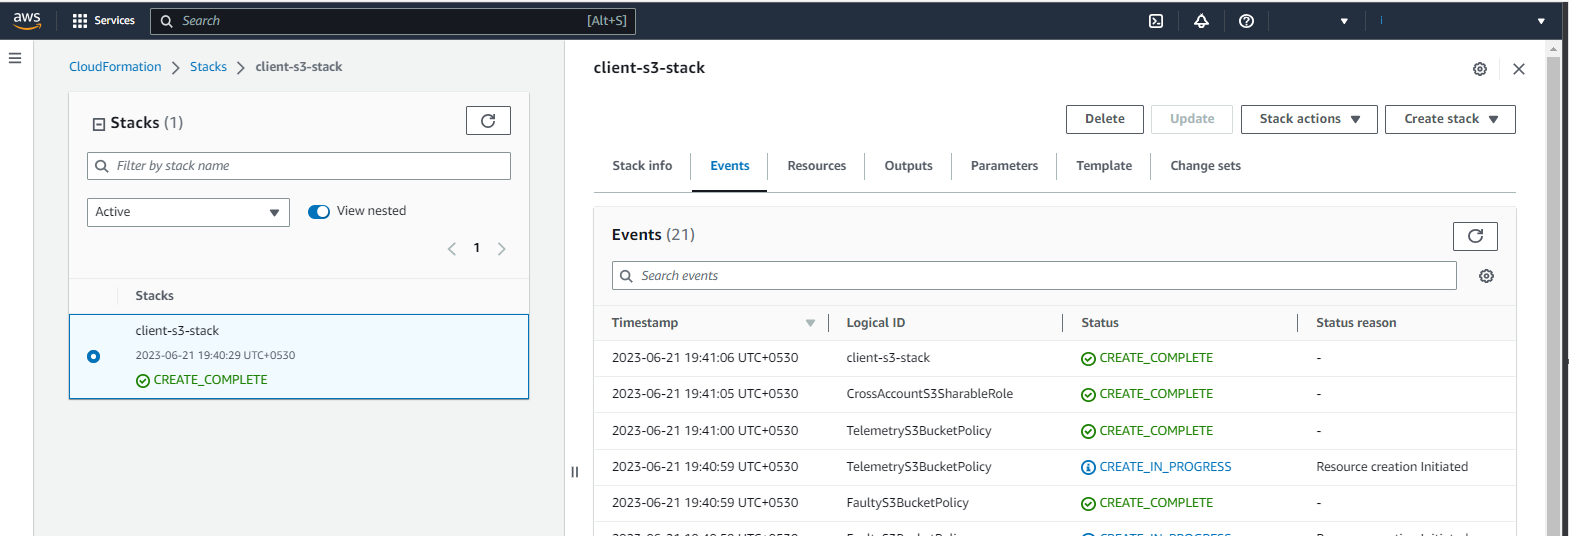
(Screen: CloudFormation Stack Creation – In Progress)
Now go back to the /IOTCONNECT™ screen. You will see the change on a screen. It will ask what types of data that platform should dump into your DynamoDB, select them and click Save.
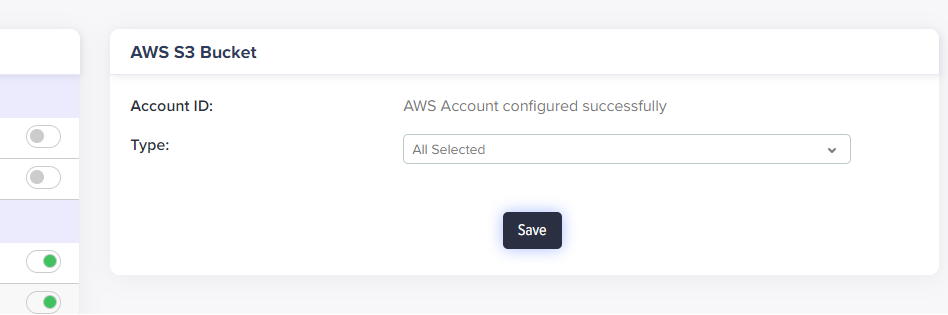
(Screen: Select The Data Type)
Setup Athena in AWS
Open Athena service and click Launch query editor.
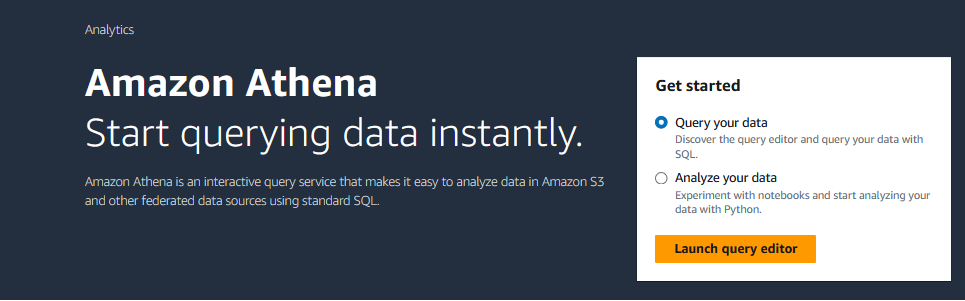
(Screen: Amazon Athena – Get Started)
In the query editor, paste the following query.
CREATE database `device-telemetry-database`
This will create a new database into AwsDataCatalog data source.
Now copy below query and run to create table into device-telemetry-database database. [this is sample query without partition]
CREATE EXTERNAL TABLE IF NOT EXISTS `device-telemetry-database`.`device-telemetry` (
`deviceId` string, `time` string, `payload` array < STRUCT < dt: STRING, id: STRING, tg: STRING, d: STRING > >
)
ROW FORMAT SERDE ‘org.openx.data.jsonserde.JsonSerDe’
WITH SERDEPROPERTIES (
‘ignore.malformed.json’ = ‘FALSE’,
‘dots.in.keys’ = ‘FALSE’,
‘case.insensitive’ = ‘TRUE’,
‘mapping’ = ‘TRUE’
)
STORED AS INPUTFORMAT ‘org.apache.hadoop.mapred.TextInputFormat’ OUTPUTFORMAT ‘org.apache.hadoop.hive.ql.io.HiveIgnoreKeyTextOutputFormat’
LOCATION ‘LOCATION_OF_S3_BUCKET’
TBLPROPERTIES (‘classification’ = ‘json’);
Note: You need to update the location of an S3 bucket created during setup. You can find your S3 bucket by searching device-telemetry or device.
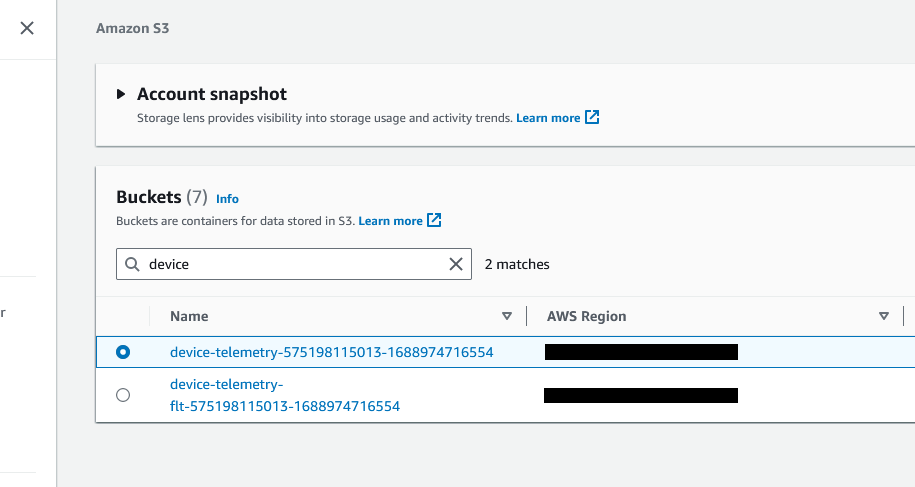
(Screen: Locate AWS S3 Bucket)
Note:
- You can give location based on need. If you want to build a dashboard for the device, your path should be s3://device-telemetry-575198115013-1688974716554/[device-id]/. If you are going to create a partition for the device, you need to give for root s3://device-telemetry-575198115013-1688974716554/.
- The folder must end with /.
If you are setting up Athena for the first time, you need to set up the query result location first. If this step is not done, you will see an information icon on your editor.
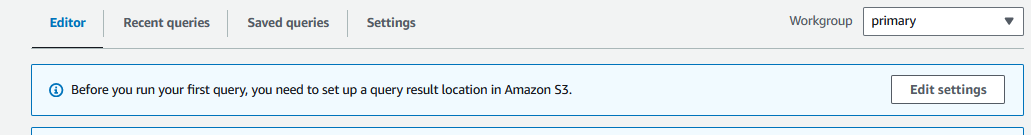
(Screen: Set Up The Query Result Location)
Click edit settings and set query location.
Once you replace location into Query, click Run.
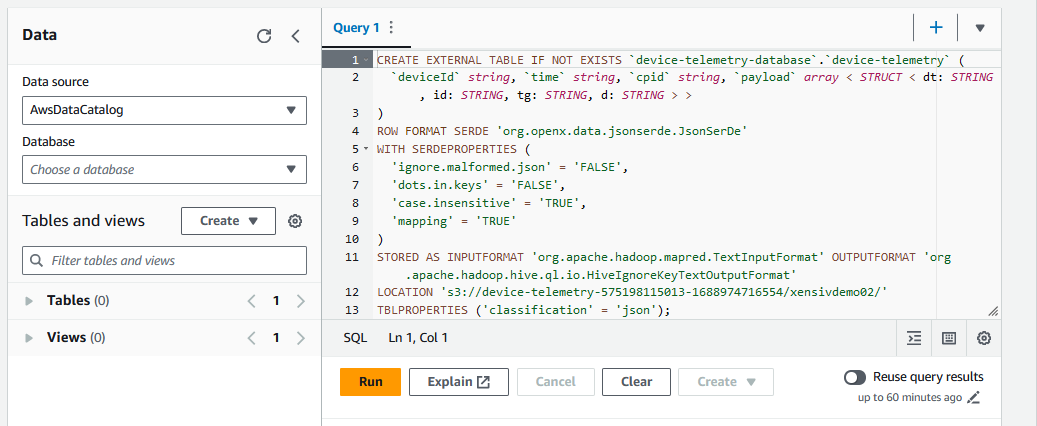
(Screen: Set Up The Query Result Location)
Once the query is successfully executed, start your device and send the data. You will see this data in this table. To view this, select a table and choose the preview table.
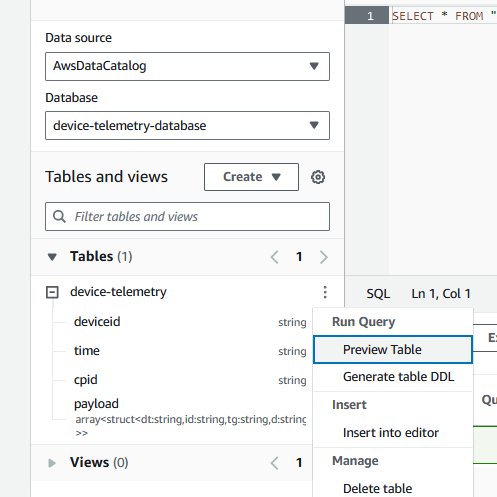
(Screen: Preview Table)
Create an IAM user to authenticate access to Athena date from Grafana. A user should have the below policy access. Please download the security credentials file. We need this while configuring the data source in Grafana.
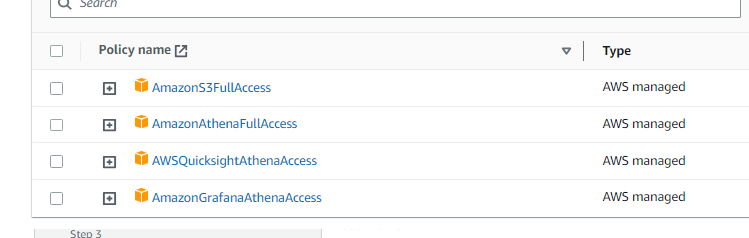
(Screen: Authenticate Access To Athena)
Setup Grafana Instance
Log in to your Grafana instance and add a new connection for Amazon Athena.
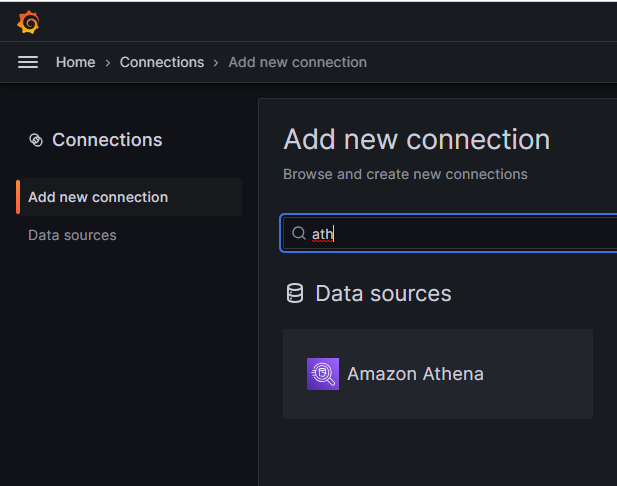
(Screen: Add New Connection)
Provide all details and test your connection. In authentication, you must select Access & secret key and use the key created in the previous step.
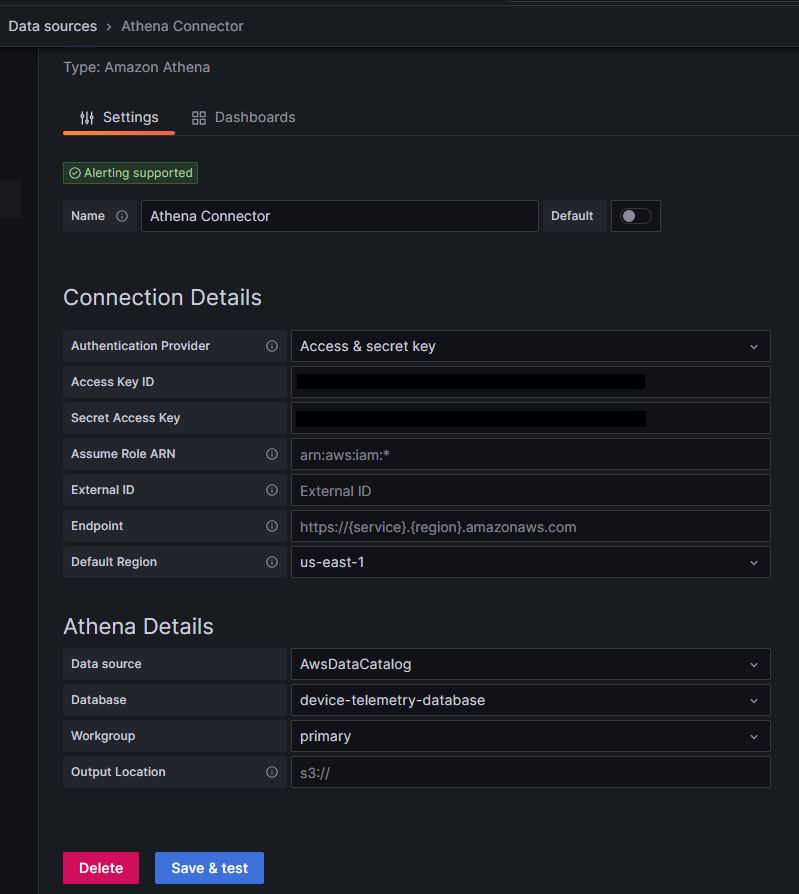
(Screen: Athena Connector)
A click on Save & test should give a “Data source is working” message.
Athena connector is configured. Now you need to create a new dashboard and add panels to it. While creating a dashboard, it will ask for the data source. Select the Athena data source that we just configured. Once done, it should open the panel and query editor at the bottom.
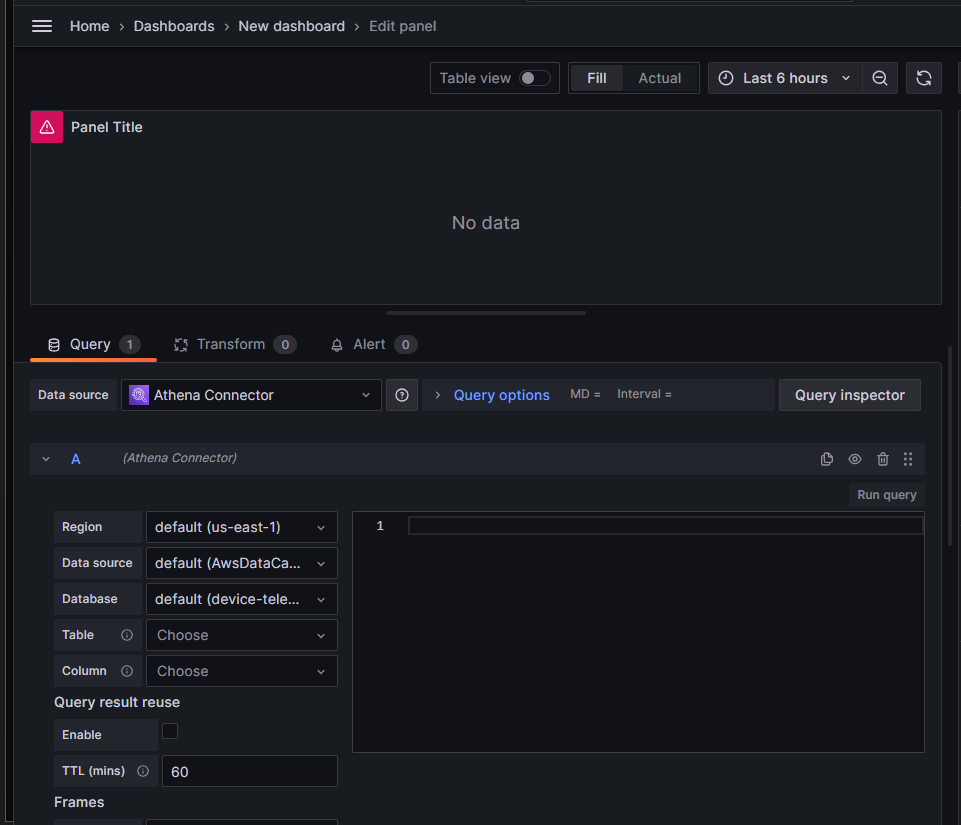
(Screen: Create A New Dashboard)
Create Grafana service in AWS
Enable Grafana service into your AWS account and create a new workspace.
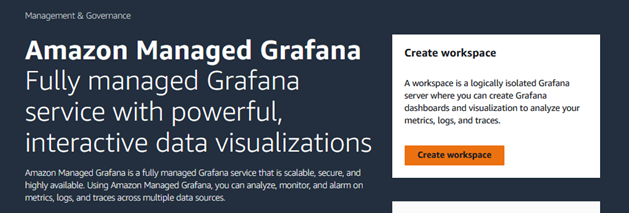
(Screen: Create Workspace)
Give workspace name. In configuration settings, select AWS IAM Identity Center (This is needed to connect the Athena source we have created). You need to create a new IAM Identity Center user if not enabled. Once that user is created, you will see Enabled on authentication access. You can leave other settings as defaults.
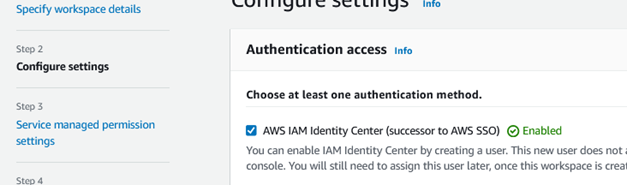
(Screen: Configure Settings)
In service managed permission settings, ensure to select Amazone Athena in a data source.
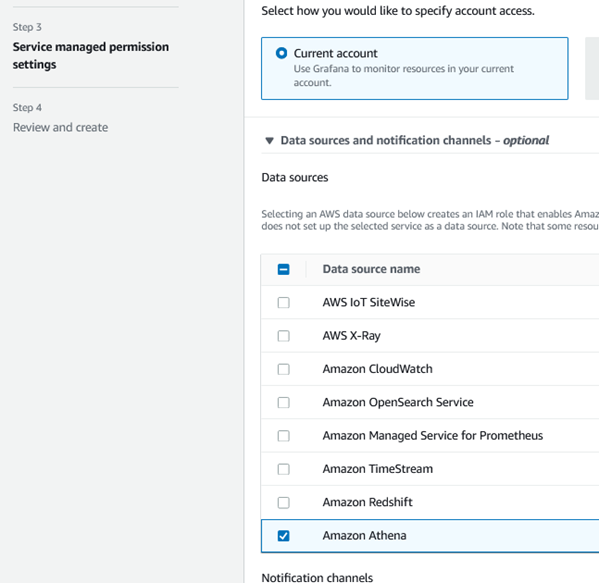
(Screen: Service Managed Permission Settings)
Review and create a workspace. Once the workspace is created and the status becomes activated, open the workspace URL to set up Grafana.
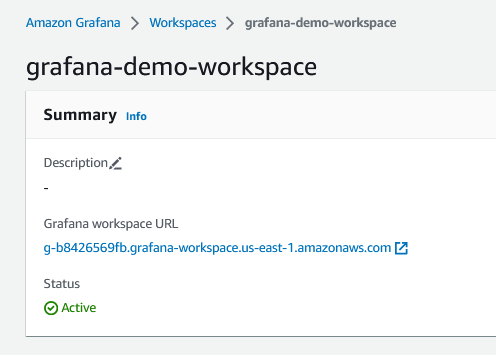
(Screen: Active Status Of A Workspace)
Configure Grafana
Open Grafana workspace URL.
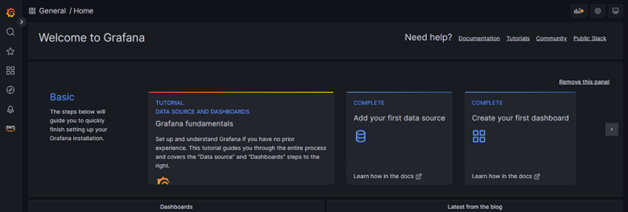
(Screen: Grafana Workspace)
Click Add data source and select Athena.
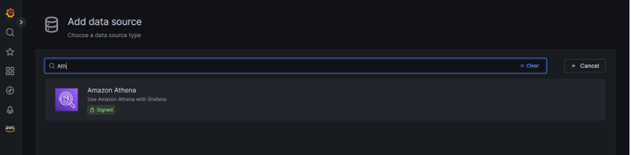
(Screen: Add Data Source)
In the settings table, change the database in Athena details. Rest, let it be a default.
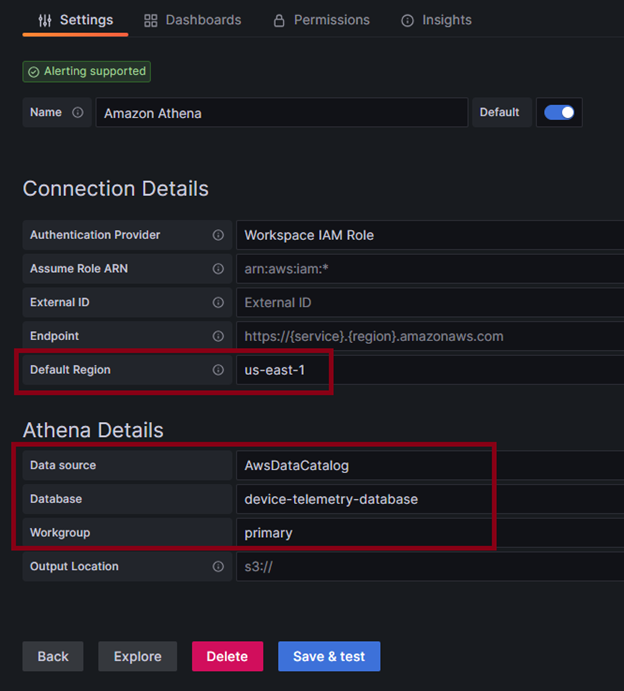
(Screen: Grafana Settings)
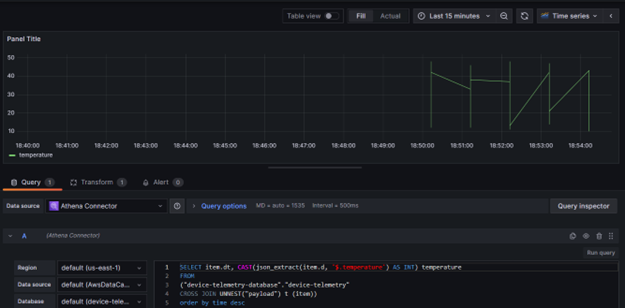
You are done with the connector setup with a click on Save & test. To create a Grafana dashboard, on dashboard, configure one panel, write a query as per requirements, and change visualization.
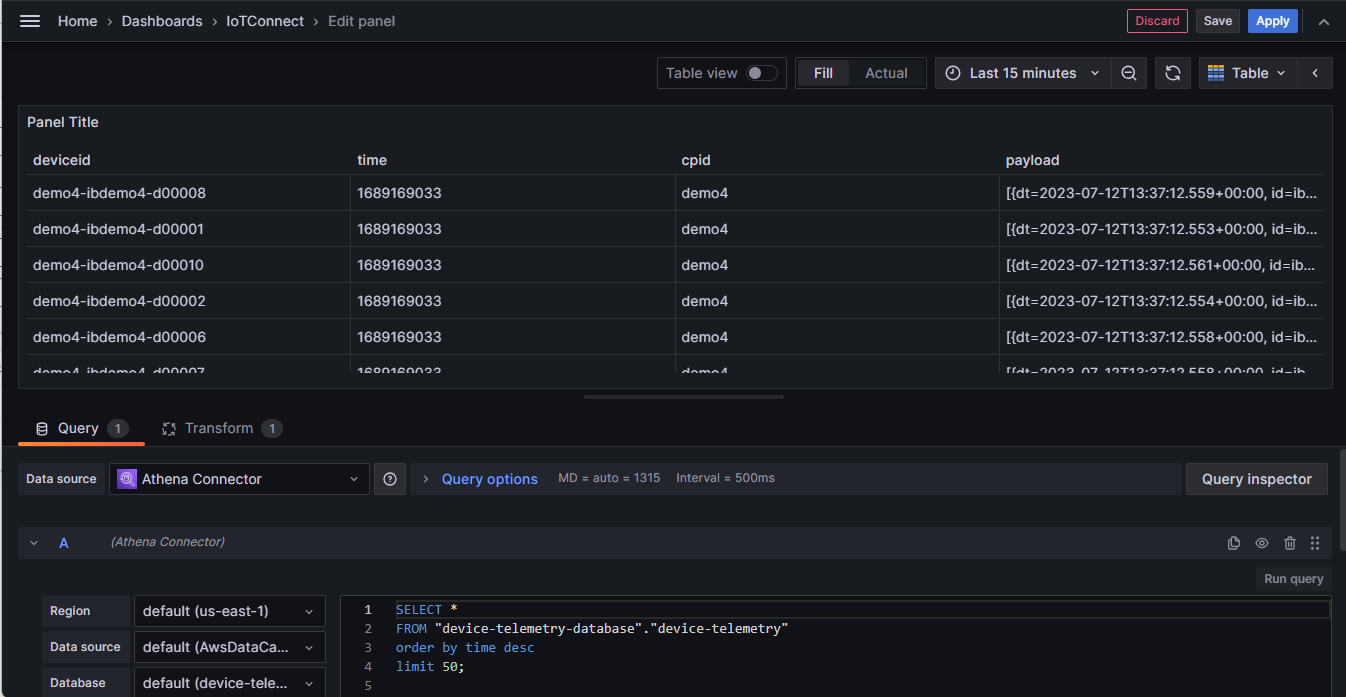
(Screen: Panel Configuration)
Furthermore, you can extract Json value and get actual sensor value out of it.
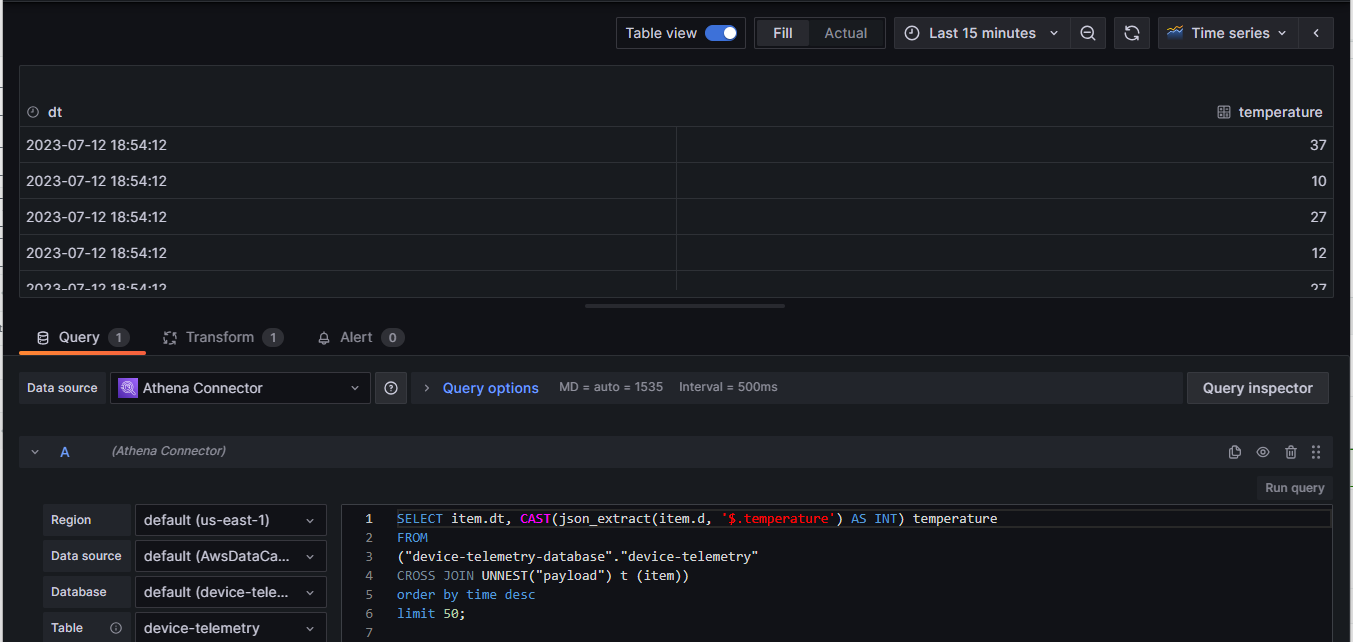
(Screen: Get Actual Sensor Value)
You can change the table view to visualization and select any visualization. Before this, you need to convert the field type of dt to Time in Transformation.
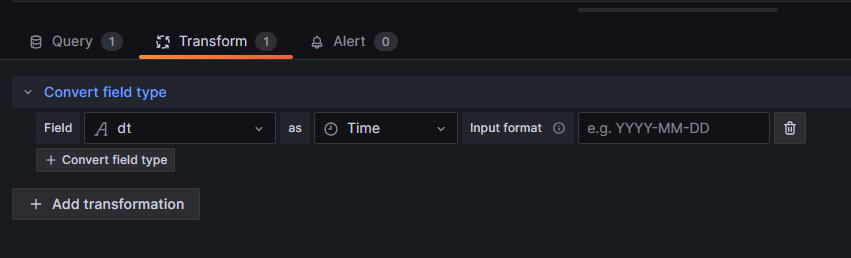
(Screen: Transform)
Set auto refresh time to make sure the panel got auto refreshed.
(Screen: Set Auto Refresh Time)
Save your required changes. Go to the dashboard and click Share from the three dots on the panel.
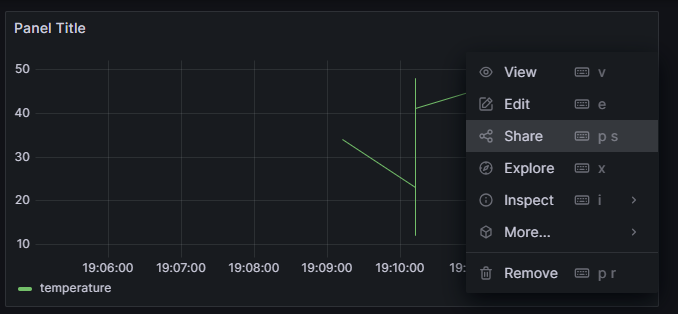
(Screen: Share A Panel)
Click Embed and copy to clipboard or copy only the source from HTML given on the screen.
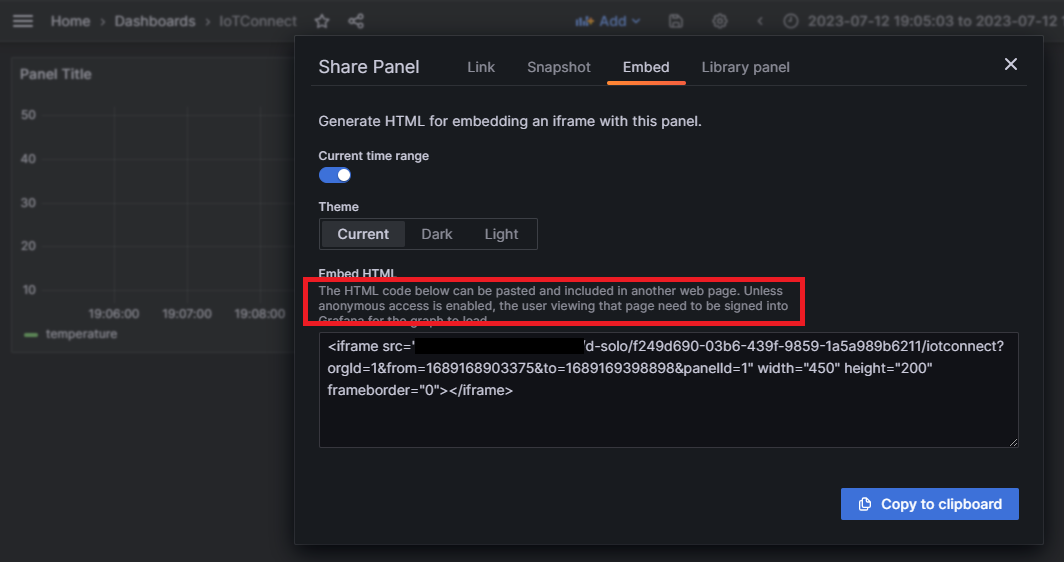
(Screen: Share A Panel)
https://YOURDOMAIN/d-solo/f249d690-03b6-439f-9859-1a5a989b6211/iotconnect?orgId=1&from=1689167547288&to=1689171147289&refresh=1m&panelId=1
for this copied
Here we need to make sure that anonymous access is enabled as well as allow the embedding option. Else you will get the “Load denied by X-Frame-Options: <Panel_URL> does not permit framing.” error.
For this, you need to make anonymous access enabled form setting.
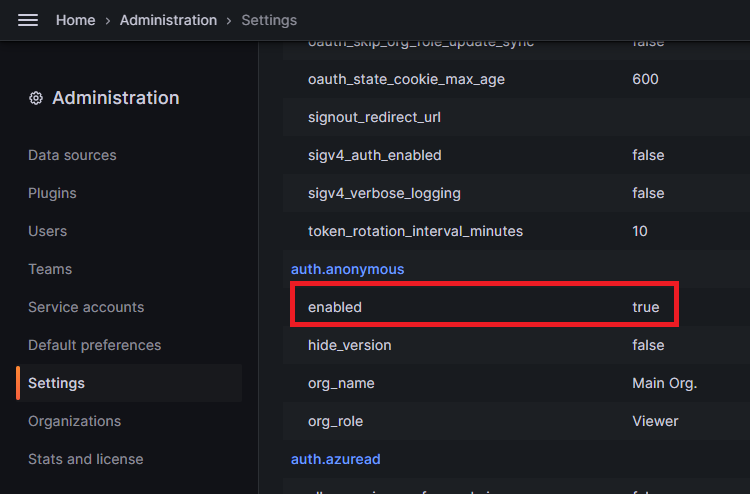
(Screen: Enable Access)
And allow embedding from security.
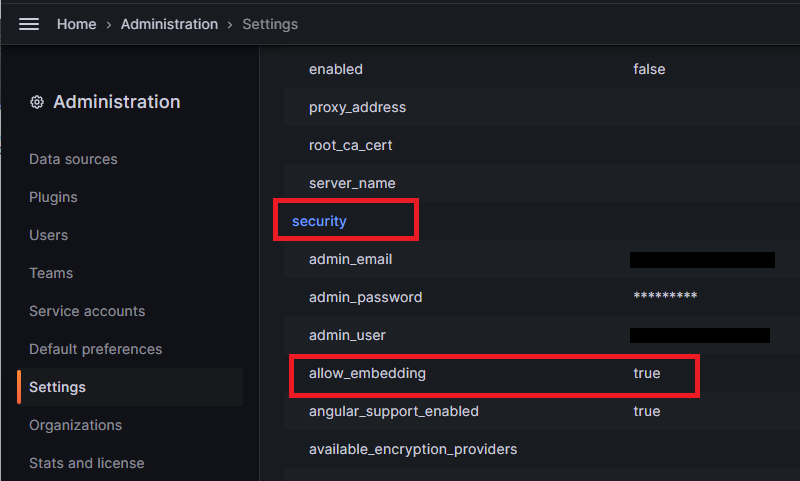
(Screen: Allow Embedding)
Add Grafana to /IOTCONNECT™ Dashboard
To add Grafana to your /IOTCONNECT™ dashboard, return to your /IOTCONNECT™ account. On the dashboard, add the Grafana widget from other widget sections.
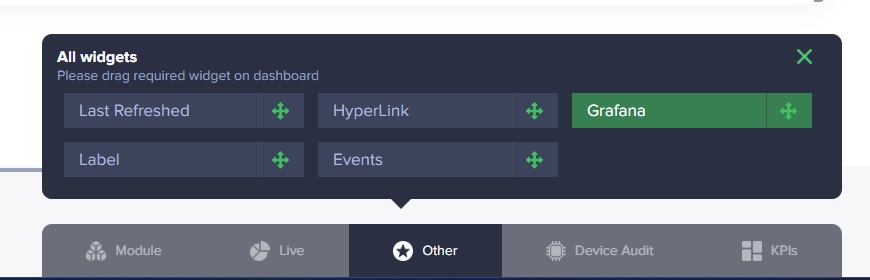
(Screen: Add Grafana Widget)
Click edit form dots to configure the widget in the link specified URL, which you got from the embed dialogue.
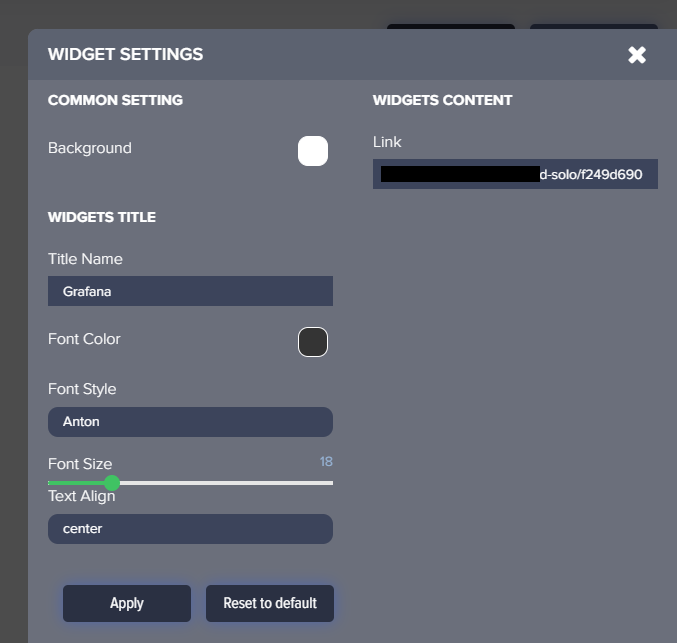
(Screen: Widget Settings)
Once saved, you will see data on your dashboard.
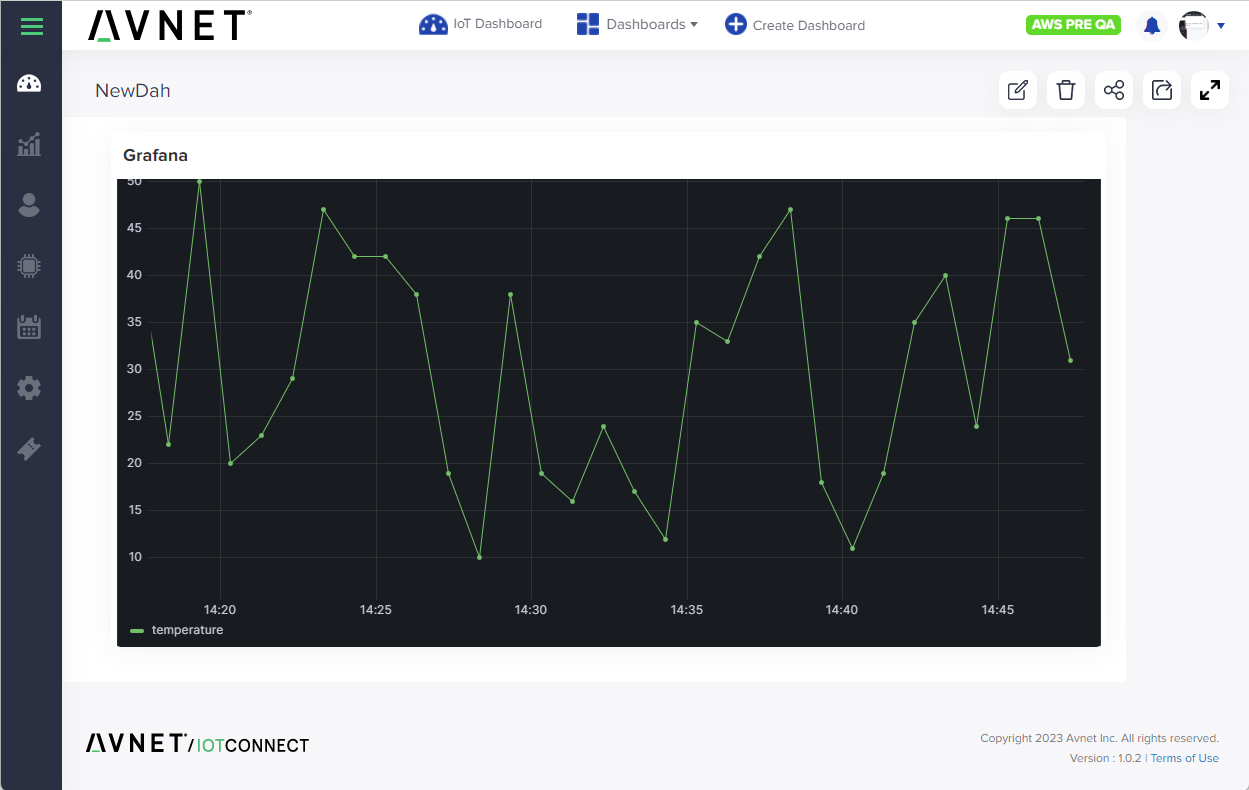
(Screen: Grafana In /IOTCONNECT™ Dashboard)