Manage Devices
Manage devices describe the tools that /IOTCONNECT™ offers to manage a device. You can view device information; get the latest values and live data; execute commands, shadow and notifications; check device health, and export historical data.
To manage a device:
- Click on the Unique ID from the device list or select the Edit Device icon from the actions lane. A click on either will show you the tabs to manage a device.
Device Info

(Screen: Device Info)
Connection Info
Connection Info pop-up provides the user details that they can use to connect to a specific device. It also has the option to download certificates required to connect the device.
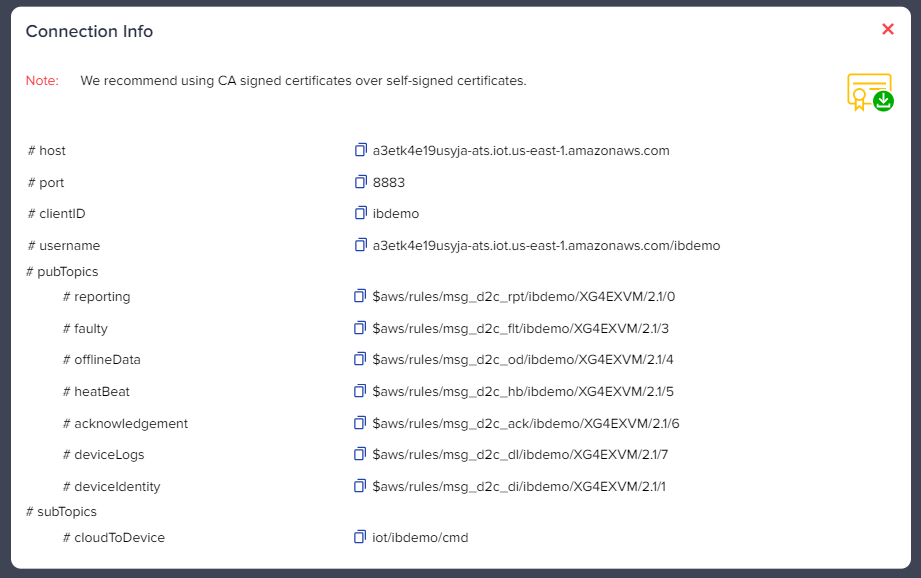
(Screen: Connection Info)
Latest Value
The latest value helps you to know the last state of a device. The tab shows the date and time, attribute name, the latest data value you have received from the device and notification.

(Screen: Latest Value)
Live Data
Get the live data when the device is connected to AWS IoT Core. /IOTCONNECT™ allows you to see your live data in three ways.
Telemetry
Telemetry data shows the time, reporting device measurement with precision and a time zone.

(Screen: Live Data – Telemetry)
Graph
The graph presents live data in graph format.
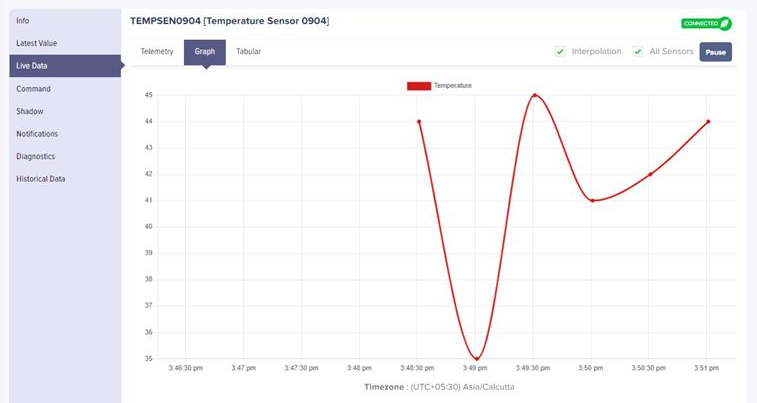
(Screen: Live Data – Graph))
Tabular
As the name suggests, it presents the data in table format. Here, you can enter the value to know the device data for attribute and condition. In the table, you will see columns for data type, time and attribute names.
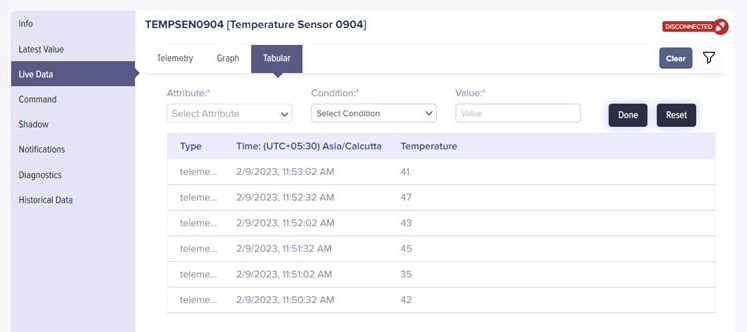
(Screen: Live Data – Tabular)
Command
- Select a command you have created while creating or editing a template.
- Enter the parameter value for the command.
- Click Execute Command.

(Screen: Command)
Shadow
For more information on Shadow, see details mentioned on Shadow in the template features.
- Select a Shadow you have created while creating or editing a template.
- Enter the desired value.
- Click Update Shadow.

(Screen: Shadow)
Notifications
Notifications are triggered when a defined condition is met. Each notification displays the number of times it has been activated and its severity level. If necessary, you may set a preferred date range for viewing notifications.
- Select the start and end date.
- The table below will update the values automatically in each column.
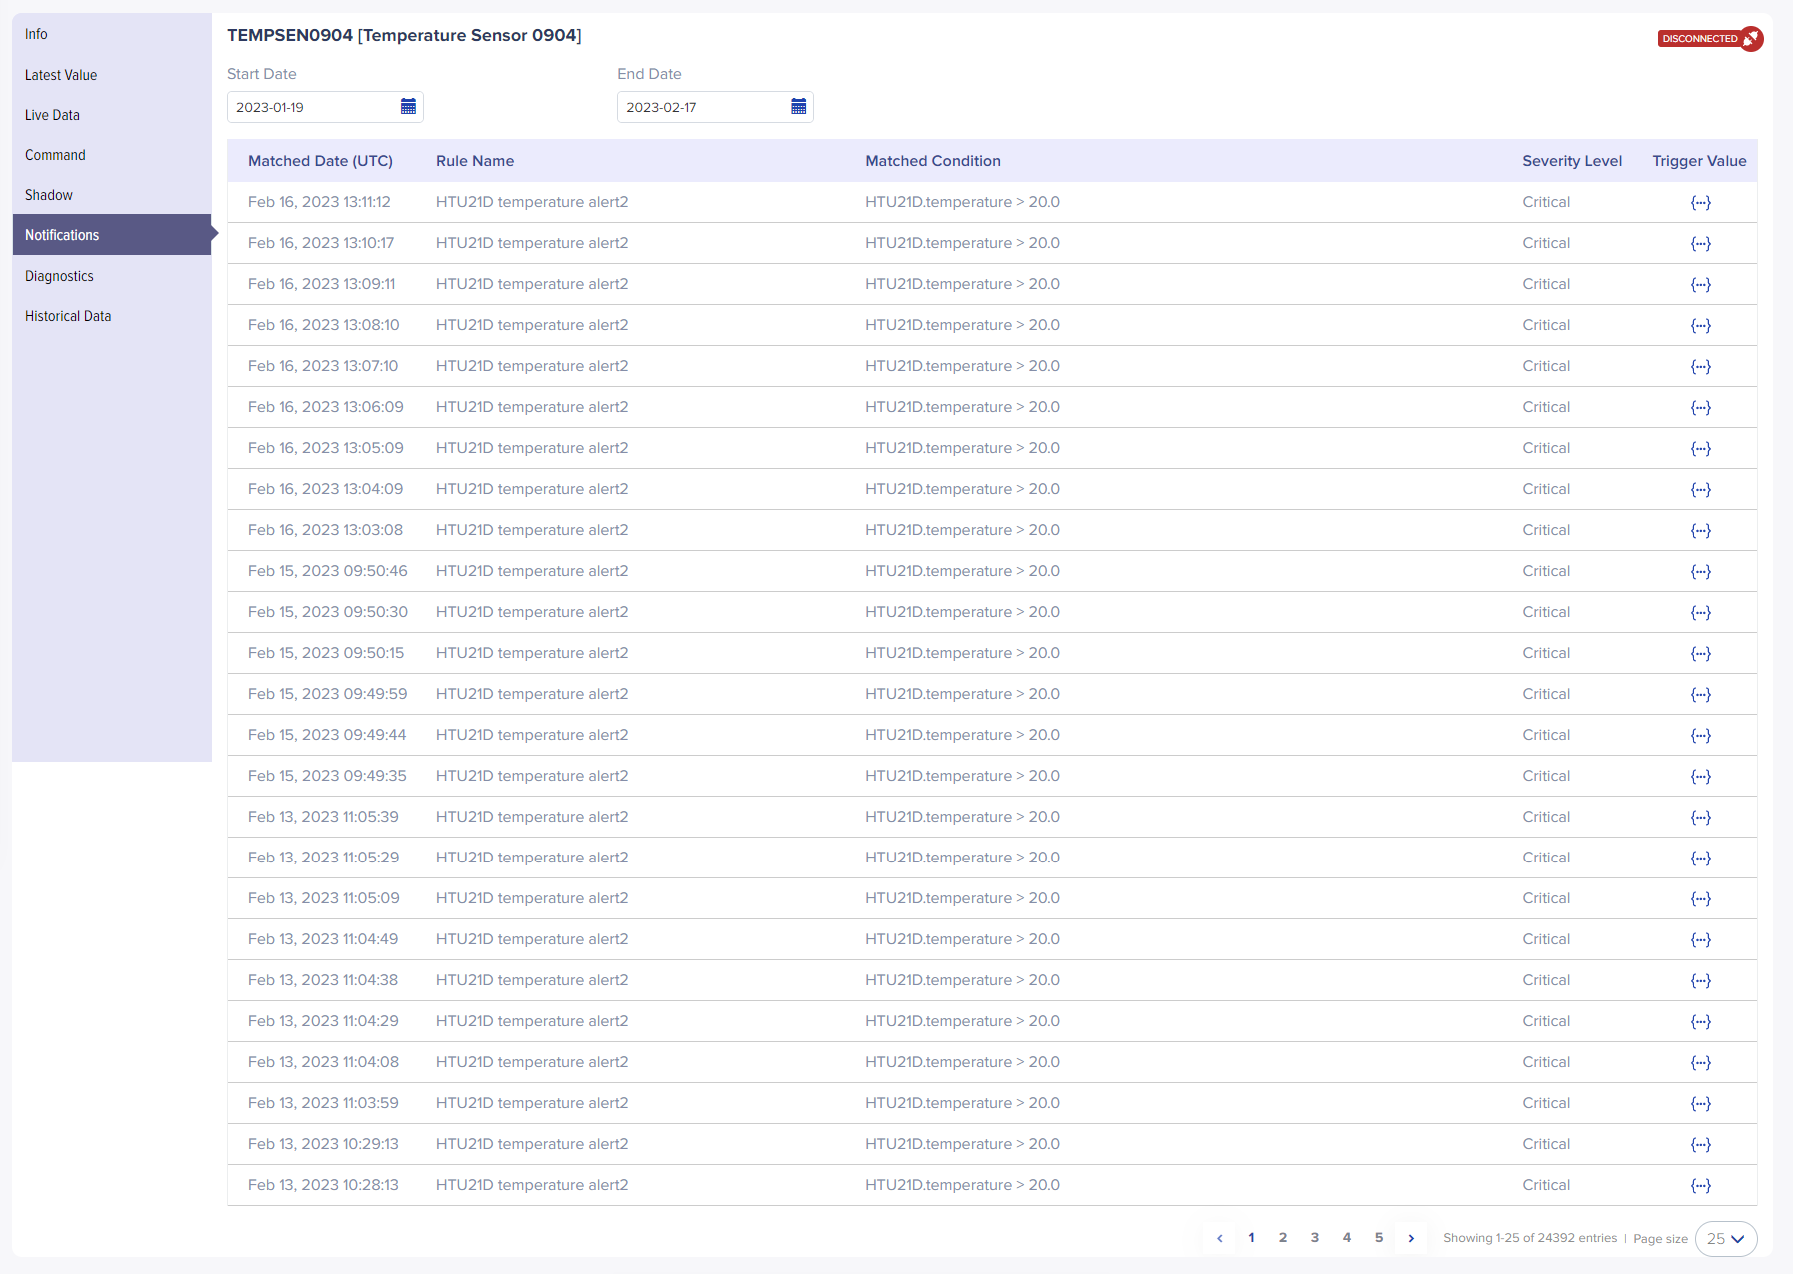
(Screen: Notifications)
Diagnostics
Diagnostics offers a comprehensive view of device operation over a specified duration. By selecting the required start and end dates, device operation information related to the chosen time frame is quickly accessible.
- Select the start and end date.
- The table below will update the values automatically in each column.
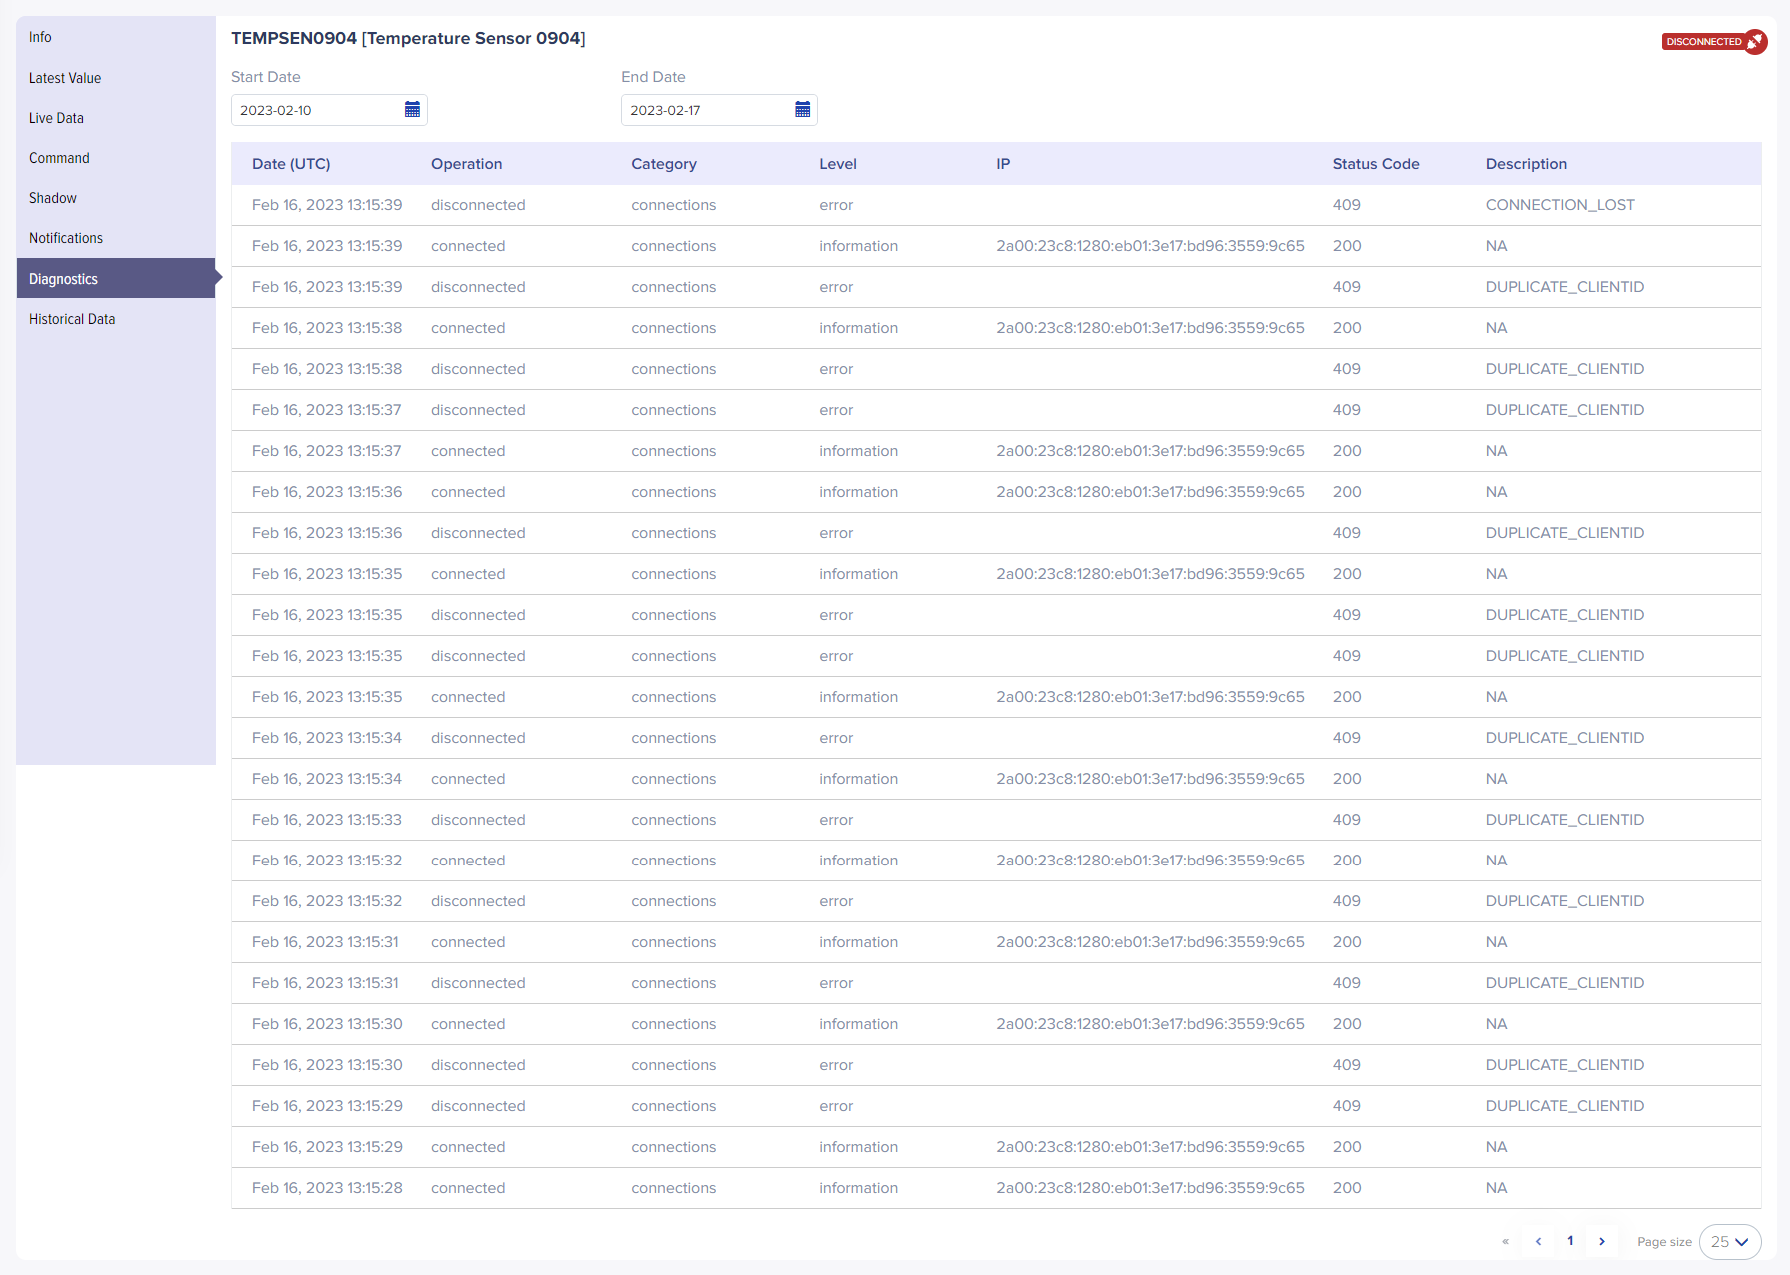
(Screen: Diagnostics)
The table highlights the date, device diagnostics operation (connected or disconnected to /IOTCONNECT™), category and level provides the device information with its IP, status code and description. If there is an error, that raw shows the status code and its description, like the error is due to a connection lost, duplicate client ID, etc.
Historical Data
/IOTCONNECT™ allows you to quickly review device monitoring data by utilizing historical data. From within the application, you can run a report for each device and view it in either graph or tabular formats by setting the start and end date. Moreover, exported .csv and .xml files permit further manipulation of this information with other applications as desired. You can accomplish all these with the click of a GO button!
- Select the start and end date and click GO.
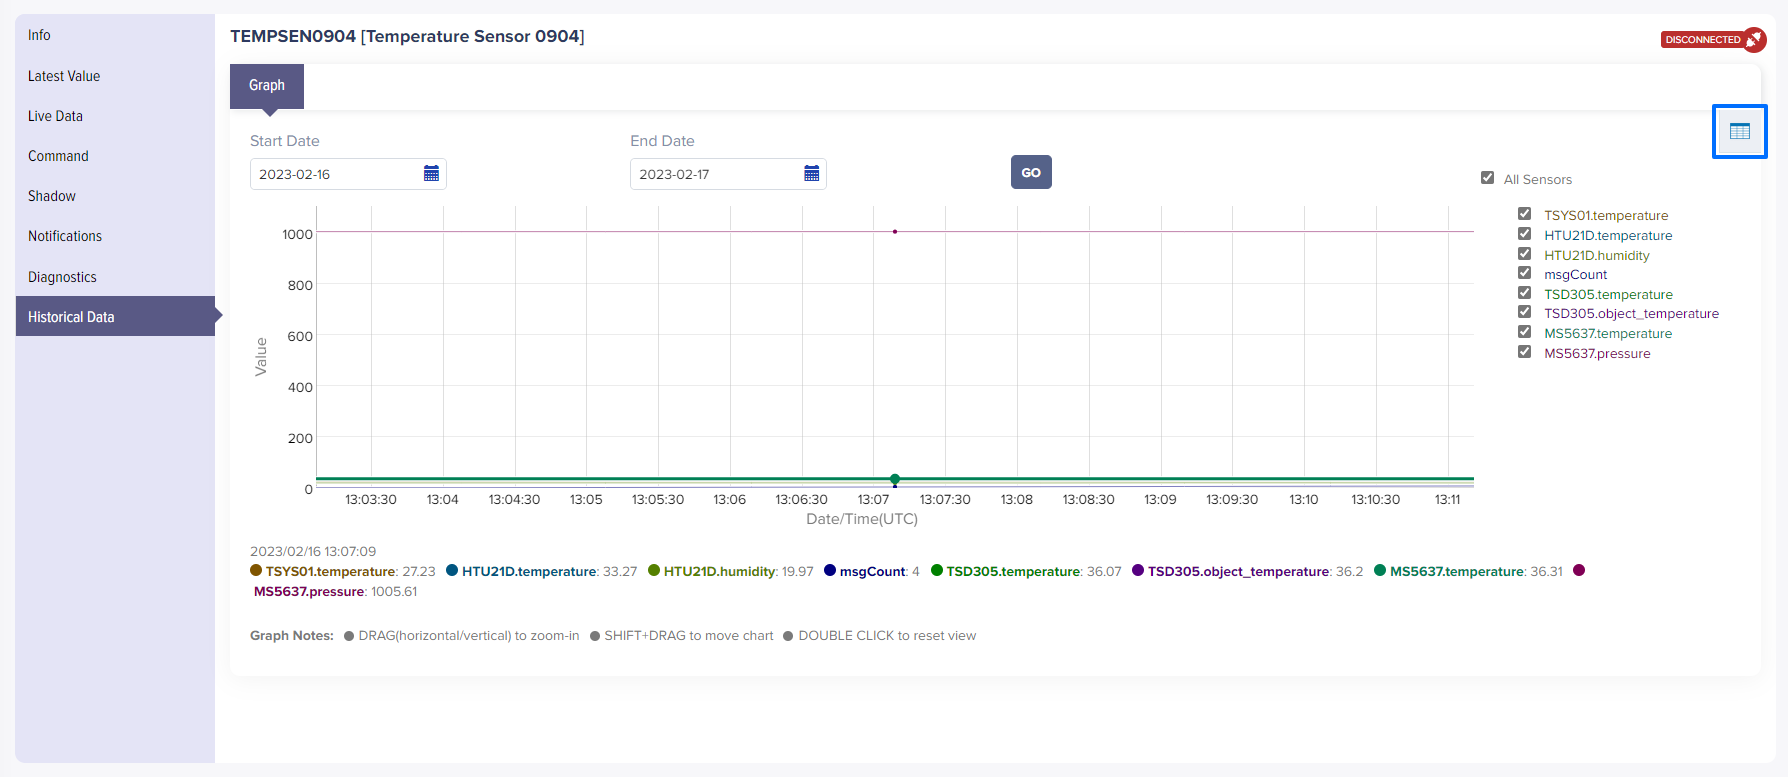
(Screen: Historical Data – Graph)
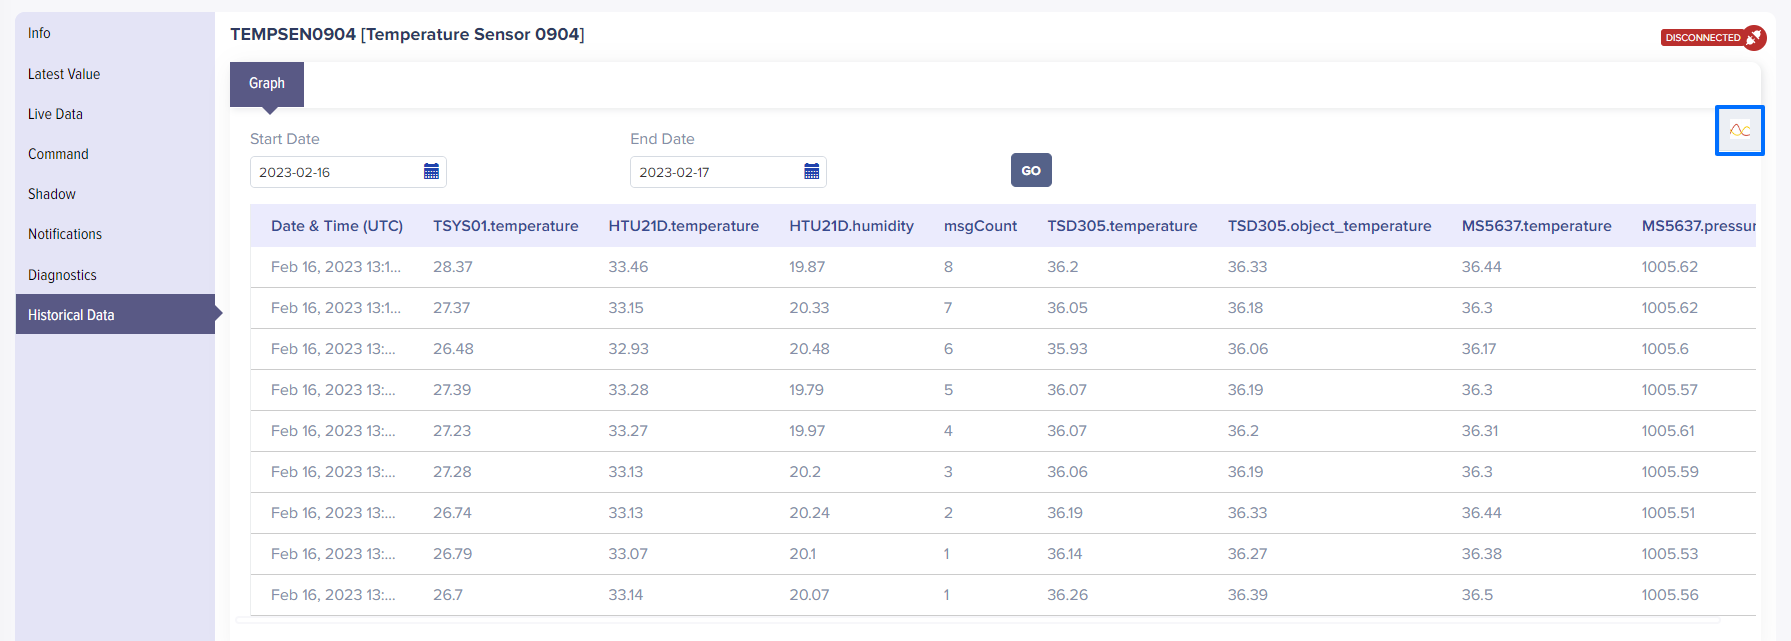
(Screen: Historical Data – Tabular)
